Marking an region with different background color in TGraph


Please read tips for efficient and successful posting and posting code

ROOT Version: 6.14/04
Platform: linuxx8664 (Ubuntu 16.04.12)
Compiler: gcc 5.4.0


Hi,
I was making some multiplot from an ASCII file using TGraph. There I wanted to mark certain regions (as exclusion region) with different background colors. Is there a way to do it? I have attached a sample code herewith and a plot that I want of the type.
MyGraph.C (1.6 KB)

Regards,
Saumyen

1 Like

What are the data ? your macro needs “inputFile”

You can take any data file. I attaching here one such file and a modified macro as well.
CSvsE.C (1.8 KB) CSvsE.txt (446 Bytes)

Regards,
Saumyen

Try something like this, just before drawing the multigraph:

  TGraph *excl[2];
  // larger area
  Double_t x1[5] = {5,12,12,5,5};
  Double_t y1[5] = {1,1,10,10,1};
  excl[0] = new TGraph(5,x1,y1);
  excl[0]->SetLineColor(41);
  excl[0]->SetFillColor(41);
  excl[0]->SetFillStyle(1001);
  // smaller area
  Double_t x2[5] = {5,8,8,5,5};
  Double_t y2[5] = {1,1,10,10,1};
  excl[1] = new TGraph(5,x2,y2);
  excl[1]->SetLineColor(46);
  excl[1]->SetFillColor(46);
  excl[1]->SetFillStyle(1001);

  multigraph->Add(excl[0],"LF");
  multigraph->Add(excl[1],"LF");

where x1, y1 and x2,y2 are the points (adjust accordingly) delimiting the exlusion areas (note that these are 5 points defining a closed rectangle here).
Add these graphs before adding the data graphs, so the exclusion areas don’t cover the data.

void CSvsE(){
   TCanvas *c1 = new TCanvas("c1","A Simple Graph Example",800,500);
   c1->SetGrid();
   c1->SetTickx();
   c1->SetTicky();

   TMultiGraph *multigraph = new TMultiGraph();
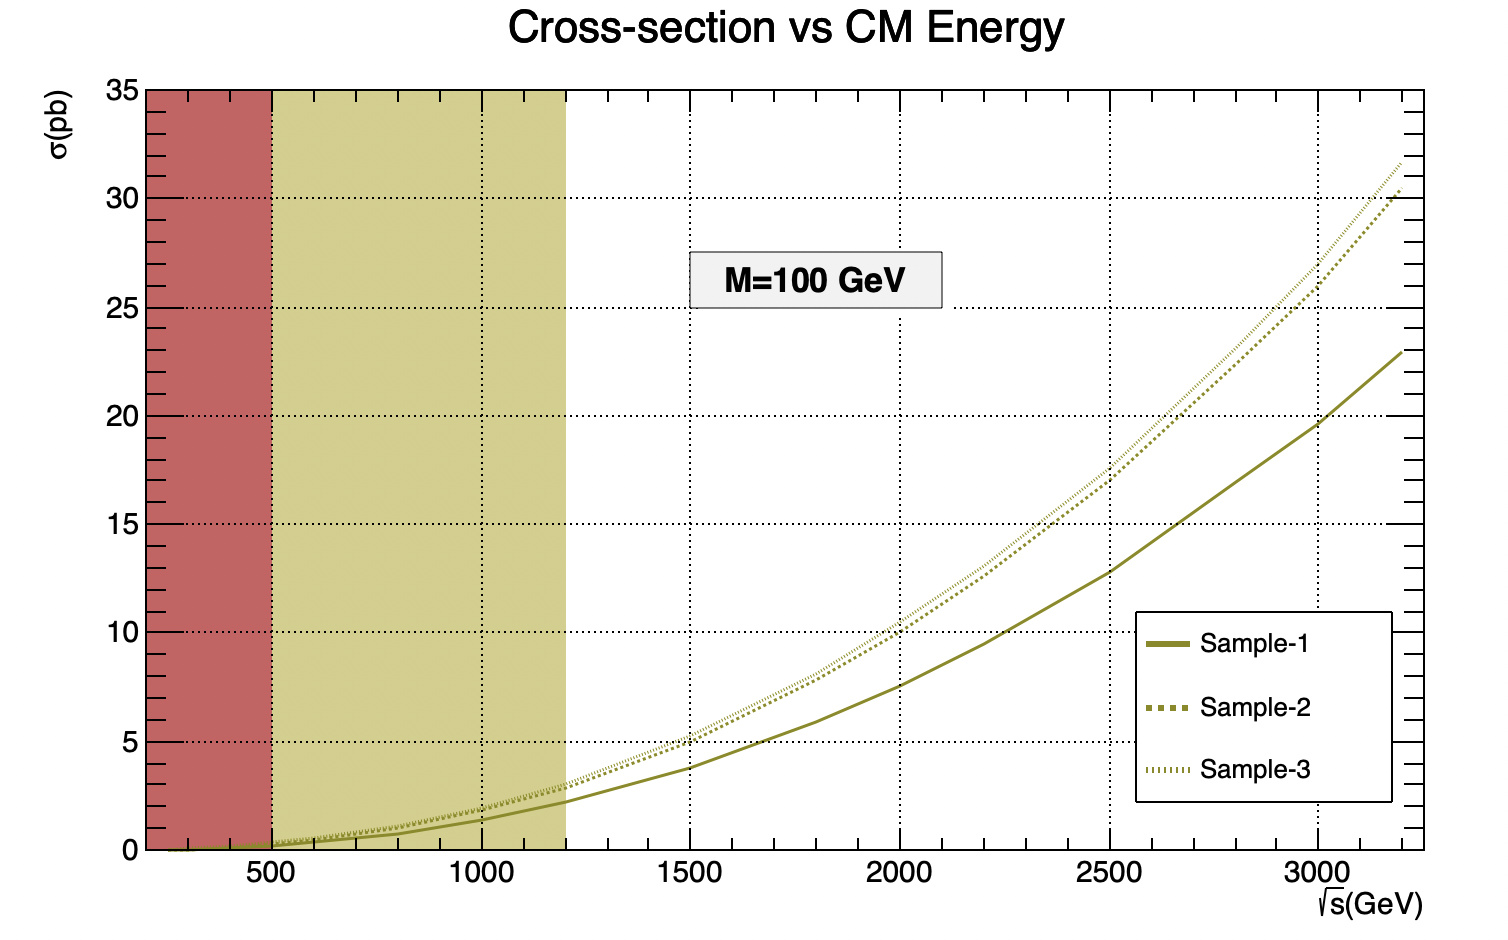
   multigraph->SetTitle("Cross-section vs CM Energy");
   multigraph->GetXaxis()->SetTitle("#sqrt{s}(GeV)");
   multigraph->GetYaxis()->SetTitle("#sigma(pb)");

   TLegend *legend = new TLegend(0.72,0.15,0.88,0.35,NULL,"brNDC");
   legend->SetTextSize(0.03);

   float max = 35;
   // larger area
   Double_t x1[5] = { 500, 1200,  1200,  500, 500};
   Double_t y1[5] = {   0,    0,   max,  max,   0};
   auto excl1 = new TGraph(5,x1,y1);
   excl1->SetLineColor(41);
   excl1->SetFillColor(41);
   excl1->SetFillStyle(1001);
   // smaller area
   Double_t x2[5] = {  0, 500,  500,   0, 0};
   Double_t y2[5] = {  0,   0,  max, max, 0};
   auto excl2 = new TGraph(5,x2,y2);
   excl2->SetLineColor(46);
   excl2->SetFillColor(46);
   excl2->SetFillStyle(1001);

   TGraph *g1 = new TGraph("CSvsE.txt", "%lg %lg");
   g1->SetLineColor(217);
   g1->SetLineWidth(3);
   g1->SetLineStyle(1);
   TGraph *g2 = new TGraph("CSvsE.txt", "%lg %*lg %lg");
   g2->SetLineColor(217);
   g2->SetLineWidth(3);
   g2->SetLineStyle(2);
   TGraph *g3 = new TGraph("CSvsE.txt", "%lg %*lg %*lg %lg");
   g3->SetLineColor(217);
   g3->SetLineWidth(3);
   g3->SetLineStyle(3);

   multigraph->Add(excl1,"F");
   multigraph->Add(excl2,"F");

   multigraph->Add(g1,"L");
   multigraph->Add(g2,"L");
   multigraph->Add(g3,"L");

   multigraph->Draw("A*");

   gPad->RedrawAxis();
   gPad->RedrawAxis("G");

   TPaveText *pt = new TPaveText(1500,25.,2100,27.5);

   pt->AddText("M=100 GeV");
   pt->SetTextColor(1);
   pt->SetTextSize(0.04);
   pt->SetShadowColor(0);
   pt->Draw();

   legend->AddEntry(g1,"Sample-1","l");
   legend->AddEntry(g2,"Sample-2","l");
   legend->AddEntry(g3,"Sample-3","l");
   legend->Draw();

   multigraph->GetXaxis()->SetLimits(200., 3250.);
   multigraph->SetMinimum(0.);
   multigraph->SetMaximum(max);

   c1->Print("CSvsE.png");
}

Thank you so much both dastudillo and couet for the help. Both code-suggestions are working fine.
Thanks a lot…

Regards,
Saumyen

This topic was automatically closed 14 days after the last reply. New replies are no longer allowed.