Hello
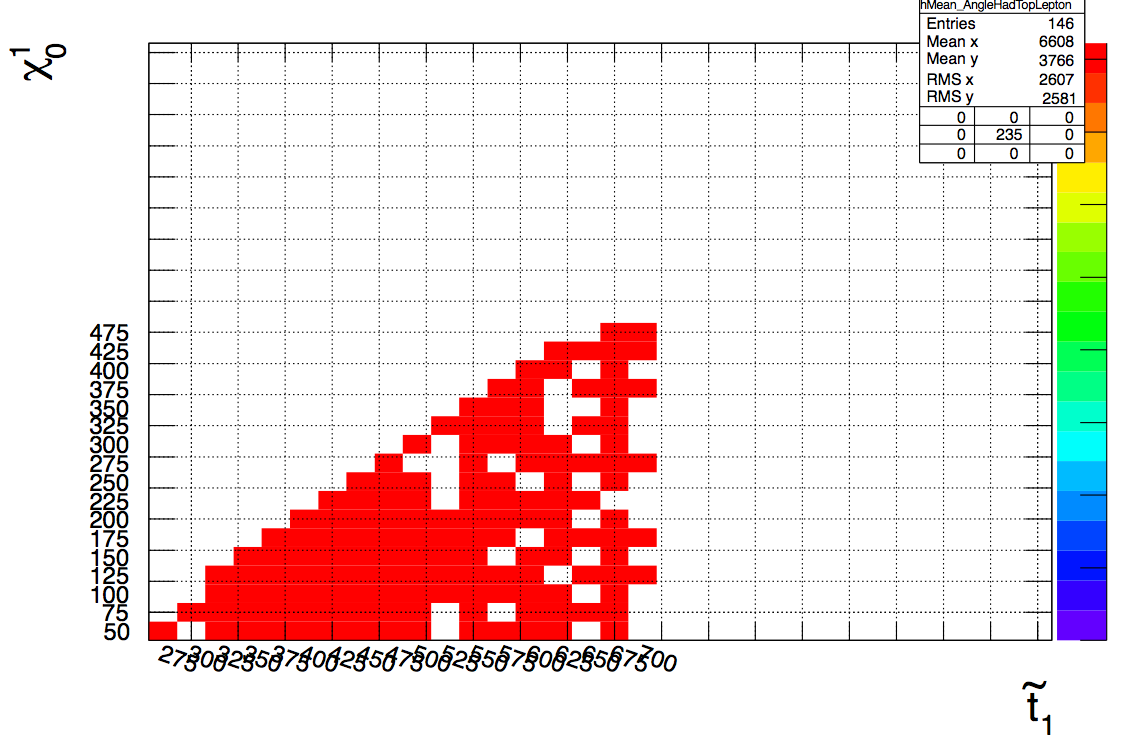
While reading one root file , I save all histograms in a big .ps file – My problem is , that while I choose the draw(“colz”) option, the plot fills almost all of the canvas , thus the palette is there, but not the units -
So, how can I draw(“colz”) and making the units on the Palette appear ? I would also like to remove the grids that appear in the final .ps file, although I do not have grids enabled in my TH2 plots.
I attach an example of my output .ps files
Thanks in advance
Alex