hello experts
I have a 2D histogram in the tree and i want only the y-axis and z-axis information to make a 1D plot about pT.
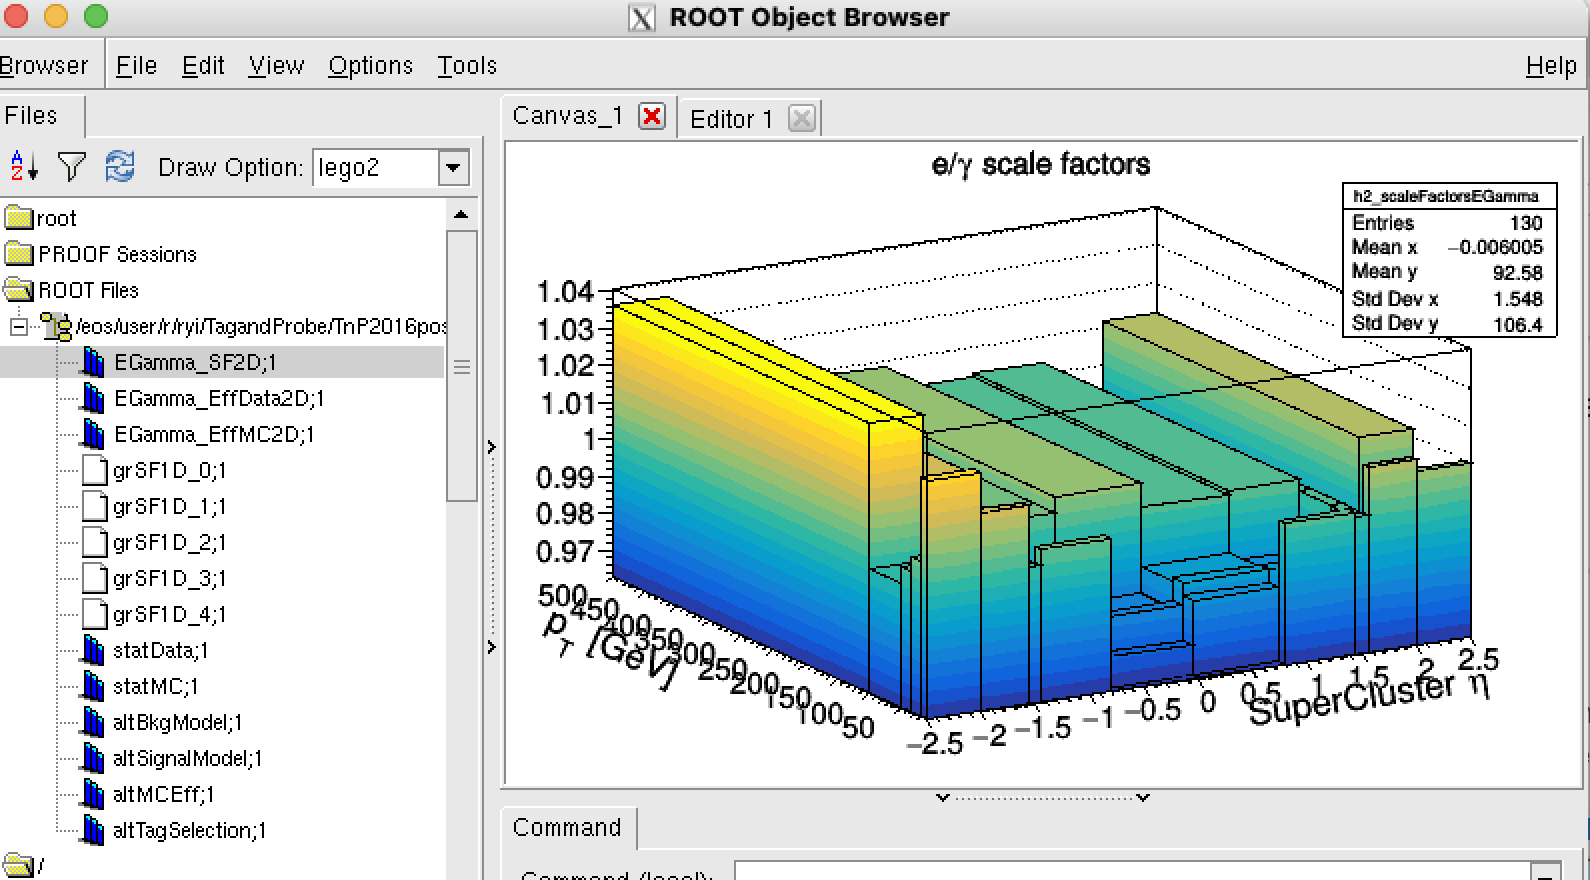
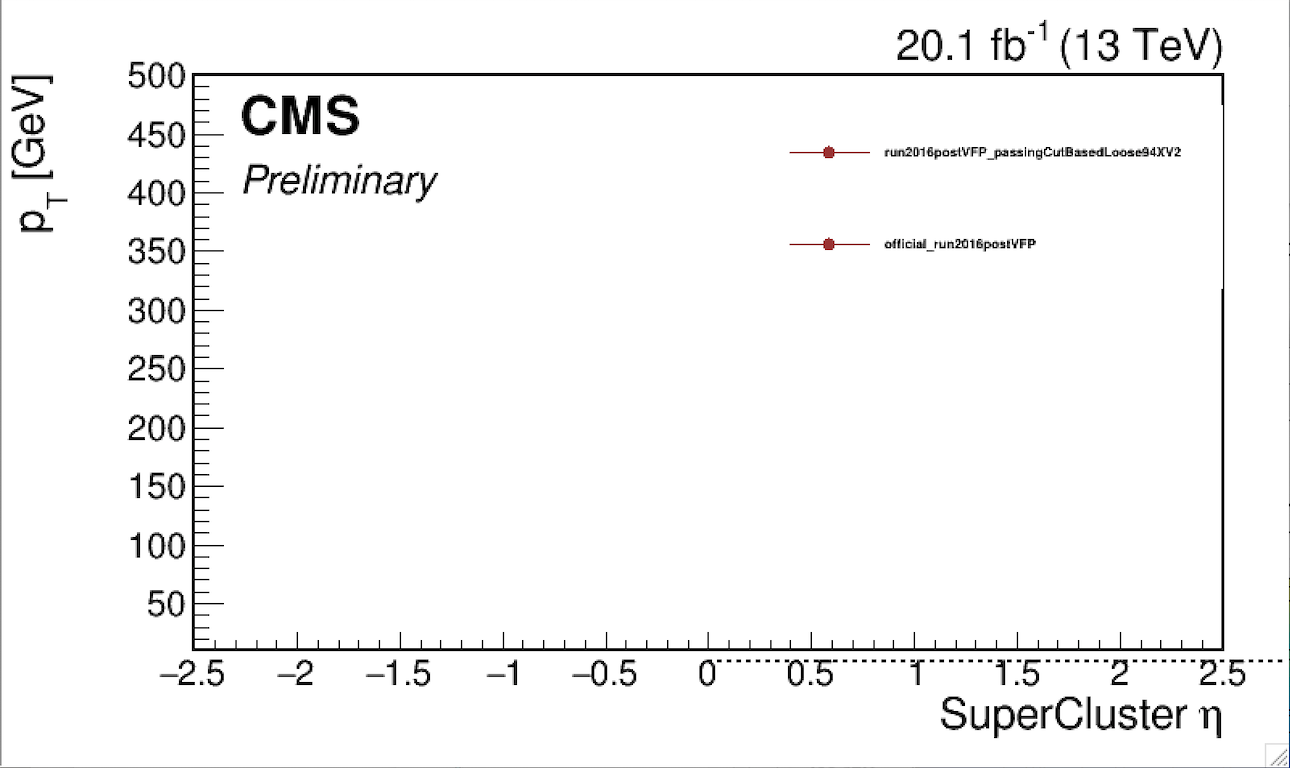
the code is here, to compare histograms from two root files. I used ProfileY() but it doesnt work, and gives error AttributeError: 'TH2F' object has no attribute 'GetHistogram', I’m wondering how to solve the problem? thanks a lot
Blockquote
#!/usr/bin/env python
import sys,os
from math import sqrt
import ROOT as rt
import libPython.CMS_lumi, libPython.tdrstyle
libPython.tdrstyle.setTDRStyle()
listOfFile = [
{ ‘path’ : ‘results/UL2016_postVFP/tnpEleID/passingCutBasedLoose94XV2/egammaEffi.txt_EGM2D.root’, ‘legend’ : ‘run2016postVFP_passingCutBasedLoose94XV2’ , ‘color’ : rt.kAzure},
{ ‘path’ : ‘/eos/user/r/ryi/TagandProbe/TnP2016post/egammaEffi.txt_Ele_Loose_postVFP_EGM2D.root’ , ‘legend’ : ‘official_run2016postVFP’ , ‘color’ : rt.kRed-2},
]
grNames = [ ‘EGamma_SF2D’ ]
c = rt.TCanvas( ‘SFs’, ‘SFs’, 800, 500 )
c.SetTopMargin(0.10)
c.SetBottomMargin(0.15)
c.SetLeftMargin(0.12)
sfMin = 0.68
sfMax = 1.32
for igr in range(len(grNames)):
legend = rt.TLegend(0.6,0.62,0.95,0.86)
legend.SetFillColor(0)
legend.SetBorderSize(0)
for ifile in range(len(listOfFile)):
    print 'Opening TFile: ', listOfFile[ifile]['path']
    rfile = rt.TFile.Open(listOfFile[ifile]['path'],'read')
    rfile.Print()
    rgr   = rfile.Get(grNames[igr])

    drawOption = "P"
    if igr == 0 and ifile == 0 :
        drawOption = "AP"
        rgr.ProfileY()
        rgr.GetHistogram().SetMinimum(sfMin)
        rgr.GetHistogram().SetMaximum(sfMax)

    rgr.SetLineColor(   listOfFile[ifile]['color'] )
    rgr.SetMarkerColor( listOfFile[ifile]['color'] )
    c.cd()
    legend.AddEntry( rgr, listOfFile[ifile]['legend'],'PL' )
    rgr.Draw( drawOption )
Blockquote
xMin = 0
xMax = 2.6
lineAtOne = rt.TLine(xMin,1,xMax,1)
lineAtOne.SetLineStyle(rt.kDashed)
lineAtOne.SetLineWidth(2)
lineAtOne.Draw()
legend.Draw()
libPython.CMS_lumi.CMS_lumi(c, 4, 10)
c.Print(‘outEleID_SFs.pdf’)