Loop over TTree speed improvement in PyROOT

Hello everyone,

actually I’m doing my first “large-Ttree” analysis in my phD and I need to use PyROOT because I will use some python packages to post-process the data. Actually I did a lot of analysis using C++ and I’m relatively new to PyROOT (but not at python).

The point is that, despite I expected lower speed with PyROOT than C++ compiled analysis program, I think that I can do a couple of things better to improve the speed over a Ttree loop but I’m not sure about how to do it.

First of all here you have the script im running: histos_for_calibrations.py (6.9 KB)
In the first part of the script I generate some empty histograms, then I fill them looping over the Ttree.

I read some tips in other posts of this forum but they are quite old and I couldn’t implement them to my code:

  1. First I tried was about SetBranchAddress of my Ttree as actually I access to my branches with something like: tree.branch1 . I feel that I will improve some speed if I declare previously each branch with SetBranchAddress but the point is that im not sure of how should I do it in python. For example with C++ I do:
UShort_t        x[32];
tree->SetBranchAddress("x",x);

But If I try something similar in python like:

x = tree.SetBranchAddress('x', x)

It tells me that x is not declared previously. Do you have any idea of how to do it?

  1. I read something about ROOT dataframe, which is used in PyROOT improve the speed quite a lot, but I couldn’t find any examples or how to use that dataframe. Could you help me with that?

  2. The last point is that I also read something about compile python with pypy, but as I said, all info that I found was some years old and I’m not sure about that.

If there are some other methods different than the ones I mentioned above I will be glad to know it and try. Thank you very much for your help.
Hello,

I believe the best advice I can give you is related to your point 2. If you are starting to write this larger analysis now, I would strongly recommend you do it with RDataFrame. The code will potentially be much shorter/simpler and the event loop will happen in C++ (even if you use RDataFrame from Python via PyROOT, the heavy lifting happens in C++).

I believe the best thing would be to start by having a look at the RDataFrame docs:

https://root.cern/doc/master/classROOT_1_1RDataFrame.html

and these are the tutorials:

https://root.cern.ch/doc/master/group__tutorial__dataframe.html

The idea here is to transform your analysis in a set of transformations to a TTree dataset (e.g. filtering events, adding more columns) plus a series of actions to obtain results (e.g. filling histograms).

Please let us know if you need guidance on this adaptation of the code.

@eguiraud can be of help here too.

Thank you very much! I’ll read it all and try. If I need more help I’ll write back here again.

Really thanks!

Well I read most of the documentation that you sent me but there is something that I don’t see clear. First of all I’m going to detail the structure of my TTree then I’ll post my questions below:

  • I have 15 branches wich are: ADCX, then CH_ADCX and ADCX_HITS, where X goes from 0 to 4
  • In ADCX_HITS I have a number that tells me how many channels in my ADC have a trigger in a given event.
  • Then detectors that triggered are stored in ADCX, and the energy (channel) deposited is stored in CH_ADCX.
    For example, in the first event of my experiment 3 detectors that are connected to channels 3, 5 and 30 of ADC0 get hit, and each one of them write a count at channel 500, 1000 and 1500 respectively. So my TTree will have for event[0]:
    ADC0_HITS = 3
    ADC0 = 3, 5, 30
    CH_ADC0 = 500, 1000, 1500

So I have to loop over the TTree with some conditions to get my Histos drawed properly, I have all the loop perfectly implemented inside the script I posted here:

But the point is that is goes very slow, so I’m trying to translate it to RDataFrame as @etejedor suggested me.

The main problem I’ve found after read the documentation and examples is that I can’t see clear how to access to each one of my branches inside a explicit for loop with some if conditions. For example,
I actually do something like that in python (that works but is slow):

# Get my TTree from a .root file
inputFile1 = ROOT.TFile.Open(inputDir+"ROOT_files/He3_calib_34_0.root")
DSSDs_SiBall_Calib_tree = inputFile1.Get("t")
# Generate empty histograms to be filled
for i in range(32):
    FT_1_2.append(ROOT.TH1F("FT_1_2_"+str(i),"FT_1_2_%i ; Channel ; Counts" % (i), 4096,0,4096))
# Fill my histograms with TTree data, looping over it
for event in DSSDs_SiBall_Calib_tree:
    Esiball1_2=0
    if DSSDs_SiBall_Calib_tree.HITS_ADC3 != 0:
        for i in range(DSSDs_SiBall_Calib_tree.HITS_ADC3):
            Esiball1_2 = DSSDs_SiBall_Calib_tree.CH_ADC3[i]
            FT_1_2[DSSDs_SiBall_Calib_tree.ADC3[i]].Fill(Esiball1_2)
# Save my histograms into a .root file
output_file = ROOT.TFile.Open(inputDir+'analysis/3He_calib_histos.root', 'RECREATE')
histos = output_file.mkdir('Calibration_runs')
FT_12 = histos.mkdir('FT_1_2')
FT_12.cd()
for h in FT_1_2:
    h.Write()

Trying to translate it to RDataFrame to improve some speed block me here:

inputDir = '~/Documents/IEM/3He_CMAM/'
d = ROOT.RDataFrame('t', inputDir+"ROOT_files/He3_calib_34_0.root")

then if I try to draw an histogram with:

hist = d.Histo1D('CH_ADC0')
hist.Draw()

It draws but now the correct spectra as I need to set some if conditions to plot histograms correctly.Could you help me with that?

I’ve also tried something like:

d.ADC0[1]

To check if I could access to my branches on each event but don’t work.

I’m sorry for those longs posts but I want to detail it as much as possible to not take too much time to solve it. Thank you for your help!

Hi,
if you want to discard an entire event, you use Filter:

# h only contains events for which `x > 0`
h = df.Filter("x > 0").Histo1D("CH_ADC0")

If, for each event, you want to select only certain array elements, you use a Define:

# h is filled with all the elements of `good_pts`, for each event
h = df.Define("good_pts", "pt[pt > 0]").Histo1D("good_pts")

You can concatenate Defines and Filters at will.

See the docs linked above for more information.

Cheers,
Enrico

Thanks @eguiraud for your answer.

I have a doubt, imagine that you have in the first event of your TTree:

ADC0 = [0,1, 31, 5, 0, 0, 0, 0]
CH_ADC0=[120, 40, 3450, 1345, 0, 0, 0, 0]

Then a second event look like that:

ADC0 = [0, 28, 4, 1, 0, 0, 0, 0]
CH_ADC0=[450, 233, 2345, 99, 0, 0, 0, 0]

If I want to make a Histo1D with only the values of CH_ADC0 associated to ADC0 = 1, so I’ll have a histogram with 1 count at channel 40 (given by the 1st event) and 1 count at channel 99 (given by the 2nd event).

How should be the .Define and .Filter concatenation to achieve that?

Because I find in the documentation some filters and conditions to just value branches easy to define, but I don’t find anywhere examples for “vectorial” branches. Neither also conditions for just only few elements in one branch, or any condition that let me Filter in one branch and let me take an index to fill the histograms with the same branch element in a different branch.

We definitely need to improve that part of the docs, it’s actually an open issue.

You can do the following:

df.Define("good_channels", "CH_ADC0[ADC0 == 1]").Histo1D("good_channels")

Some more details are available under “Usage in combination with RDataFrame” here, in the documentation of RVec, our special vector-like class that defines those nice operations.

Cheers,
Enrico

Thank you @eguiraud ! I’ll take a look during the weekend.

Definetly I tested a lot of ways of Filters and Define but no one of them plots me the correct histogram. I really don’t have idea of what I’m doing wrong. I’ll let you some examples below:

If I run this code in python:

import ROOT
inputFile2 = ROOT.TFile.Open(inputDir+"ROOT_files/He3_calib_35_0.root")
PAD = ROOT.TH1F("PAD_4", "PAD_4", 4096,0,4096)
PADs_Calib_tree = inputFile2.Get("t")
for events in PADs_Calib_tree:
    Epad3=0
    if PADs_Calib_tree.HITS_ADC4 != 0:
        for i in range(PADs_Calib_tree.HITS_ADC4):
            if PADs_Calib_tree.ADC4[i] == 4:
                Epad3 = PADs_Calib_tree.CH_ADC4[i]
                PAD.Fill(Epad3)
   PAD.Draw()

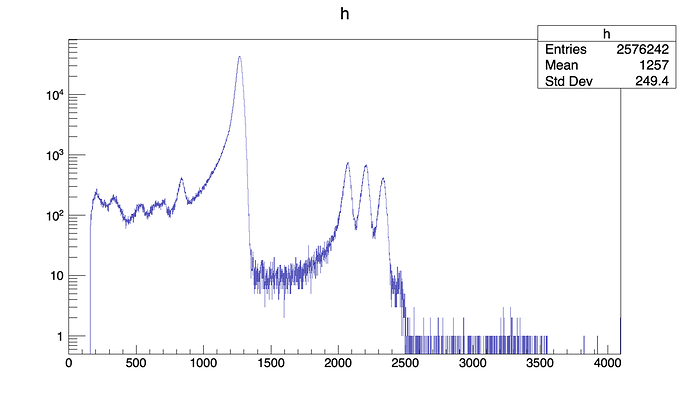
After wating some time I get:

In the other hand, if I run this code using RDataframe:

>>> import ROOT
>>> inputDir = '~/Documents/IEM/3He_CMAM/'
>>> d = ROOT.RDataFrame('t', inputDir+"ROOT_files/He3_calib_34_0.root")
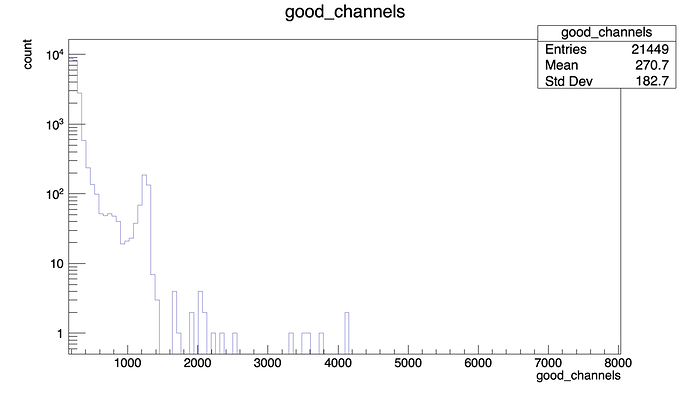
>>> h = d.Define("good_channels", "CH_ADC4[ADC4 == 4]").Histo1D("good_channels")
>>> h.Draw()

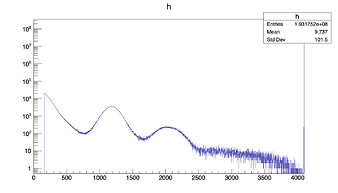
Despite I expect same result as above historgams I get:


Which is so far from real spectra.

Any suggestion to solve that? Just plot that histogram without Rdataframe took like 10 minutes, I have to generate 160 histograms… and not just 1 time. I really need any solution to speed up this process. It really seems that RDataFrame options work so much faster but It don’s solve my problem If I can’t plot what I want.

Hi @VicenteGT ,
don’t worry we can definitely plot what you want with RDF.

I see a couple of differences in the snippets you posted:

  • the input file is different, which makes it difficult to compare the outputs
  • the histogram binning is different. You can get the same binning in RDF by passing a “histogram model” argument to Histo1D: model = ROOT.RDF.TH1DModel("h", "h", 4096, 0, 4096) and then Histo1D(model, "good_channels")
  • in the first case you select events with if PADs_Calib_tree.HITS_ADC4 != 0. If HITS_ADC4 is the size of CH_ADC4 and ADC4, then I guess that selection is implicit in the RDF code, otherwise not so much

If removing these differences still yields different plots, can you please share one of the input files (also privately with me works) so I can play with it a little bit?

Cheers,
Enrico

Hi @eguiraud definetly what you posted before helped me!

The difference in the input was just a mistake copy-pasting the code, sorry :sweat_smile:
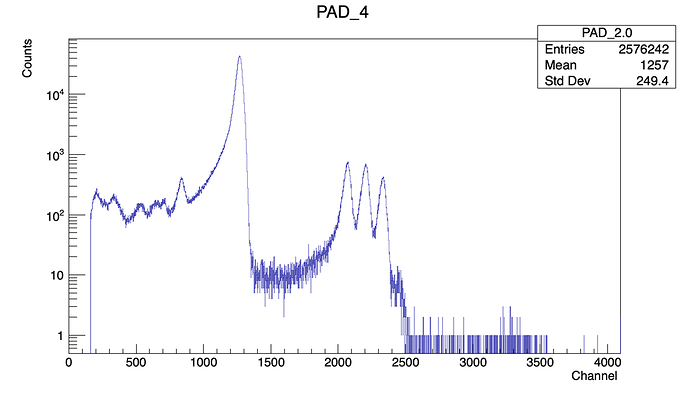
It seems that what really helped was the point 2, the histogram model. Now I get exactly the same plot:

  1. No RDataframe:
import ROOT
inputFile2 = ROOT.TFile.Open(inputDir+"ROOT_files/He3_calib_35_0.root")
PAD = ROOT.TH1F("PAD_4", "PAD_4", 4096,0,4096)
PADs_Calib_tree = inputFile2.Get("t")
for events in PADs_Calib_tree:
    Epad3=0
    if PADs_Calib_tree.HITS_ADC4 != 0:
        for i in range(PADs_Calib_tree.HITS_ADC4):
            if PADs_Calib_tree.ADC4[i] == 4:
                Epad3 = PADs_Calib_tree.CH_ADC4[i]
                PAD.Fill(Epad3)
   PAD.Draw()

  1. With RDataFrame:
>>> import ROOT
>>> inputDir = '~/Documents/IEM/3He_CMAM/'
>>> d = ROOT.RDataFrame('t', inputDir+"ROOT_files/He3_calib_35_0.root")
>>> model = ROOT.RDF.TH1DModel("h", "h", 4096, 0, 4096)
>>> h = d.Define("good_channels", "CH_ADC4[ADC4 == 4]").Histo1D(model, "good_channels")
>>> h.Draw()

Regarding to point number 3 my HITS_ADCX are just values (int) while CH_ADCX and ADCX are arrays. By default my TTree is filled with relevant values from position 0 to [HITS_ADCX], for example If I have 3 hits in a given event in channels 28, 0 and 15 my ADC and CH_ADCX will look like:
ADCX=[28, 0, 15, 0, 0, 0, …, 0]
CH_ADCX=[400, 1345, 3567, 0, 0, 0, …, 0]
So if I do:

h = d.Define("good_channels", "CH_ADC4[ADC4 == 0]").Histo1D(model, "good_channels")
h.Draw()

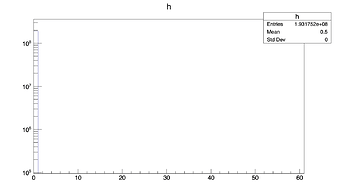
I get this:


Which is correct but I have a lot of counts at x=0 because arrays are filled with 0 (right figure), is there any way to say, just plot ADCX==0 if it’s position is < HITS_ADCX. I don’t know if I explain myself, I’m completly new using RDataFrame.

And thank you very much again @eguiraud and @etejedor for ALL your help.

Great, ok so the histogram was correct, it just looked different because of the different binning.

To discard the trailing 0’s that you don’t want to consider, just Take the first HITS_ADCX elements before plotting:

Define("good_channels", "Take(CH_ADC4[ADC4 == 0], HITS_ADC4)")

Cheers,
Enrico

EDIT:
if there are many entries for which HITS_ADC4 is 0, the loop might run faster if you add a Filter("HITS_ADC4 > 0") before the Define (so the logic after the Filter only runs if HITS_ADC4 > 0). If that’s almost never the case, the overhead of checking the Filter might be more than the computation you skip.

EDIT2:
and finally, don’t forget to book all RDF operations (e.g. do all the Histo1D calls you need) before you access any of the results (e.g. via h.Draw()), so RDataFrame accumulates “stuff to do” and fills all your histograms in the same event loop.

Thank you very much again for your help. Everything works nice now.

EDIT2:
and finally, don’t forget to book all RDF operations (e.g. do all the Histo1D calls you need) before you access any of the results (e.g. via h.Draw() ), so RDataFrame accumulates “stuff to do” and fills all your histograms in the same event loop.

Specially this part is awesome, so if I’m going to plot 160 histograms, don’t need 160 loops actually.

Really thanks again!

1 Like

This topic was automatically closed 14 days after the last reply. New replies are no longer allowed.