void fractionFitterExample() {
// Example of TFractionFitter class usage
// 1 Dimension only, x is an angle fron 0 to pi
//
// original example from Jerome Baudot May 2010
// https://indico.in2p3.fr/event/2635/contributions/25070/
// modified and updated by L. Moneta
// pointers to the data
TH1F *data; //data histogram
TH1F *mc0; // first MC histogram
TH1F *mc1; // second MC histogram
TH1F *mc2; // third MC histogram
// parameters and functions to generate the data
Int_t Ndata = 1000;
Int_t N0 = 1000;
Int_t N1 = 1000;
Int_t N2 = 1000;
Int_t nBins = 40;
Double_t trueP0 = .05;
Double_t trueP1 = .3;
Double_t trueP2 = 1.-trueP0-trueP1;
// contribution 0
TF1 *f0 = new TF1("f0", "[0]*(1-cos(x))/TMath::Pi()", 0., TMath::Pi());
f0->SetParameter(0,1.);
f0->SetLineColor(2);
Double_t int0 = f0->Integral( 0., TMath::Pi());
// contribution 1
TF1 *f1 = new TF1("f1", "[0]*(1-cos(x)*cos(x))*2./TMath::Pi()", 0., TMath::Pi());
f1->SetParameter(0,1.);
f1->SetLineColor(3);
Double_t int1 = f1->Integral( 0., TMath::Pi());
// contribution 2
TF1 *f2 = new TF1("f2", "[0]*(1+cos(x))/TMath::Pi()", 0., TMath::Pi());
f2->SetParameter(0,1.);
f2->SetLineColor(4);
Double_t int2 = f2->Integral( 0., TMath::Pi());
// generate data
data = new TH1F("data", "Data angle distribution", nBins, 0, TMath::Pi());
data->SetXTitle("x");
data->SetMarkerStyle(20);
data->SetMarkerSize(.7);
data->SetMinimum(0);
TH1F *htruemc0 = new TH1F(*data);
htruemc0->SetLineColor(2);
TH1F *htruemc1 = new TH1F(*data);
htruemc1->SetLineColor(3);
TH1F *htruemc2 = new TH1F(*data);
htruemc2->SetLineColor(4);
Double_t p, x;
for( Int_t i=0; i<Ndata; i++) {
p = gRandom->Uniform();
if( p<trueP0 ) {
x = f0->GetRandom();
htruemc0->Fill(x);
}
else if( p<trueP0+trueP1 ) {
x = f1->GetRandom();
htruemc1->Fill(x);
}
else {
x = f2->GetRandom();
htruemc2->Fill(x);
}
data->Fill( x);
}
// generate MC samples
mc0 = new TH1F("mc0", "MC sample 0 angle distribution", nBins, 0, TMath::Pi());
mc0->SetXTitle("x");
mc0->SetLineColor(2);
mc0->SetMarkerColor(2);
mc0->SetMarkerStyle(24);
mc0->SetMarkerSize(.7);
for( Int_t i=0; i<N0; i++) {
mc0->Fill( f0->GetRandom() );
}
mc1 = new TH1F("mc1", "MC sample 1 angle distribution", nBins, 0, TMath::Pi());
mc1->SetXTitle("x");
mc1->SetLineColor(3);
mc1->SetMarkerColor(3);
mc1->SetMarkerStyle(24);
mc1->SetMarkerSize(.7);
for( Int_t i=0; i<N1; i++) {
mc1->Fill( f1->GetRandom() );
}
mc2 = new TH1F("mc2", "MC sample 2 angle distribution", nBins, 0, TMath::Pi());
mc2->SetXTitle("x");
mc2->SetLineColor(4);
mc2->SetMarkerColor(4);
mc2->SetMarkerStyle(24);
mc2->SetMarkerSize(.7);
for( Int_t i=0; i<N2; i++) {
mc2->Fill( f2->GetRandom() );
}
// FractionFitter
TObjArray *mc = new TObjArray(3); // MC histograms are put in this array
mc->Add(mc0);
mc->Add(mc1);
mc->Add(mc2);
TFractionFitter* fit = new TFractionFitter(data, mc); // initialise
fit->Constrain(0,0.0,1.0); // constrain fraction 1 to be between 0 and 1
fit->Constrain(1,0.0,1.0); // constrain fraction 1 to be between 0 and 1
fit->Constrain(2,0.0,1.0); // constrain fraction 1 to be between 0 and 1
//fit->SetRangeX(1,15); // use only the first 15 bins in the fit
Int_t status = fit->Fit(); // perform the fit
cout << "fit status: " << status << endl;
// Display
gStyle->SetOptStat(0);
TCanvas * c = new TCanvas("c", "FractionFitter example", 700, 700);
c->Divide(2,2);
c->cd(1);
auto oldTitle = f0->GetTitle();
f0->SetTitle("Original MC distributions");
f0->DrawCopy();
f0->SetTitle(oldTitle);
f1->DrawCopy("same");
f2->DrawCopy("same");
c->cd(2);
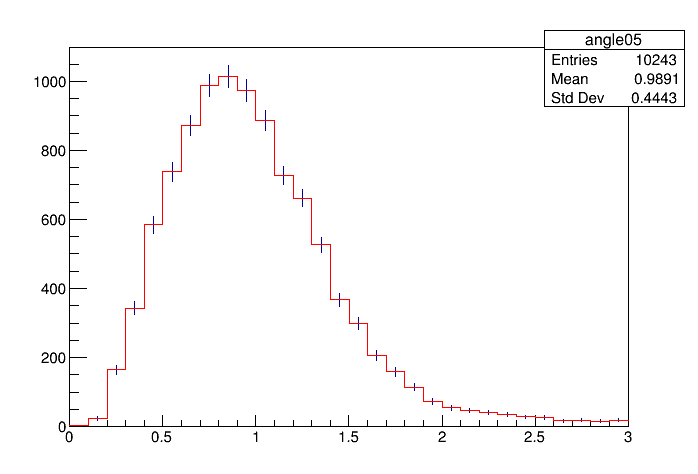
data->SetTitle("Data distribution with true contributions");
data->DrawCopy("EP");
htruemc0->Draw("same");
htruemc1->Draw("same");
htruemc2->Draw("same");
c->cd(3);
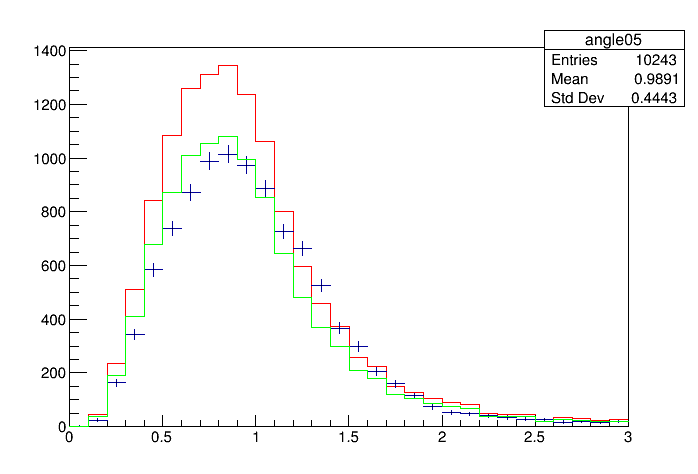
mc0->SetTitle("MC generated samples with fit predictions");
mc0->Draw("PE");
mc1->Draw("PEsame");
mc2->Draw("PEsame");
if (status == 0) { // check on fit status
auto mcp0 = (TH1F*)fit->GetMCPrediction(0);
mcp0->SetLineColor(2);
mcp0->Draw("same");
auto mcp1 = (TH1F*)fit->GetMCPrediction(1);
mcp1->SetLineColor(3);
mcp1->Draw("same");
auto mcp2 = (TH1F*)fit->GetMCPrediction(2);
mcp2->SetLineColor(4);
mcp2->Draw("same");
}
c->cd(4);
Double_t p0, p1, p2, errP0, errP1, errP2;
TH1F *mcp0, *mcp1, *mcp2;
TLatex l;
l.SetTextSize(.035);
Char_t texte[200];
if (status == 0) { // check on fit status
TH1F* result = (TH1F*) fit->GetPlot();
fit->GetResult( 0, p0, errP0);
printf(" Parameter %d: true %.3f, estim. %.3f +/- %.3f\n", 0, trueP0, p0, errP0);
fit->GetResult( 1, p1, errP1);
printf(" Parameter %d: true %.3f, estim. %.3f +/- %.3f\n", 1, trueP1, p1, errP1);
fit->GetResult( 2, p2, errP2);
printf(" Parameter %d: true %.3f, estim. %.3f +/- %.3f\n", 2, trueP2, p2, errP2);
data->SetTitle("Data distribution with fitted contributions");
data->Draw("Ep");
result->Draw("same");
f0->SetParameter(0,Ndata*p0/int0*data->GetBinWidth(1));
f0->SetLineStyle(2);
f0->Draw("same");
f1->SetParameter(0,Ndata*p1/int1*data->GetBinWidth(1));
f1->SetLineStyle(2);
f1->Draw("same");
f2->SetParameter(0,Ndata*p2/int2*data->GetBinWidth(1));
f2->SetLineStyle(2);
f2->Draw("same");
sprintf( texte, "%d: true %.2f, estimated %.2f +/- %.2f\n", 0, trueP0, p0, errP0);
l.DrawTextNDC( .45, .30, texte);
sprintf( texte, "%d: true %.2f, estimated %.2f +/- %.2f\n", 1, trueP1, p1, errP1);
l.DrawTextNDC( .45, .25, texte);
sprintf( texte, "%d: true %.2f, estimated %.2f +/- %.2f\n", 2, trueP2, p2, errP2);
l.DrawTextNDC( .45, .20, texte);
}
}