Dear fellow ROOT users and experts,
I’m looking for a way to limit the range of the x axis when I’m drawing a THStack which contains a list of TH1F’s with variable bin widths.
As I understand, If a fixed binning width configuration is used, the SetLimits() function limits the range of the x axis successfully. Although, this doesn’t apply in the variable binning case.
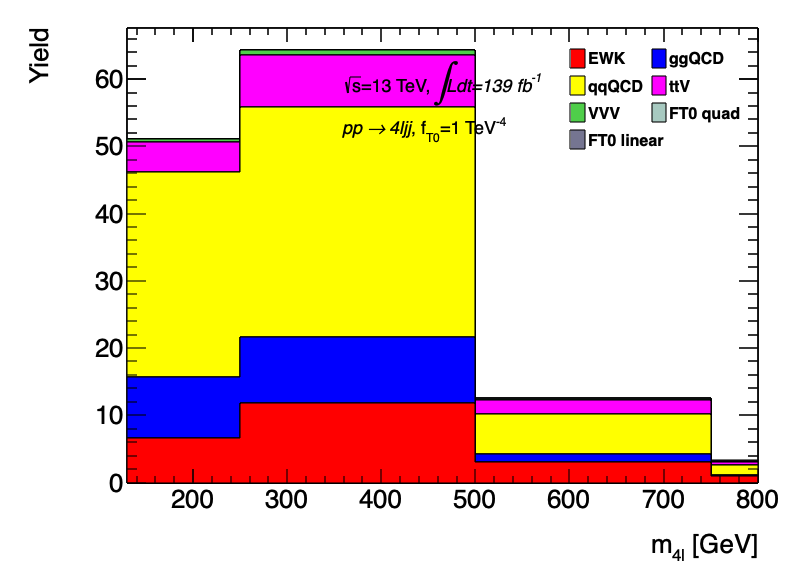
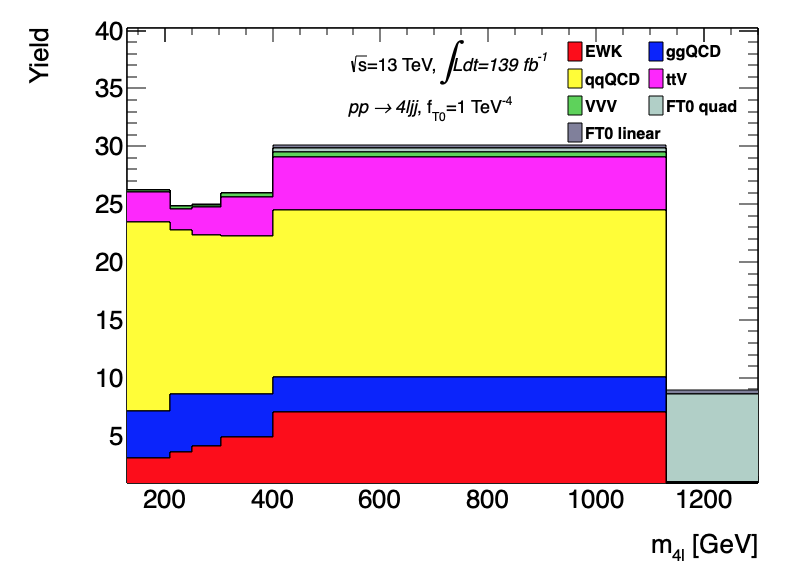
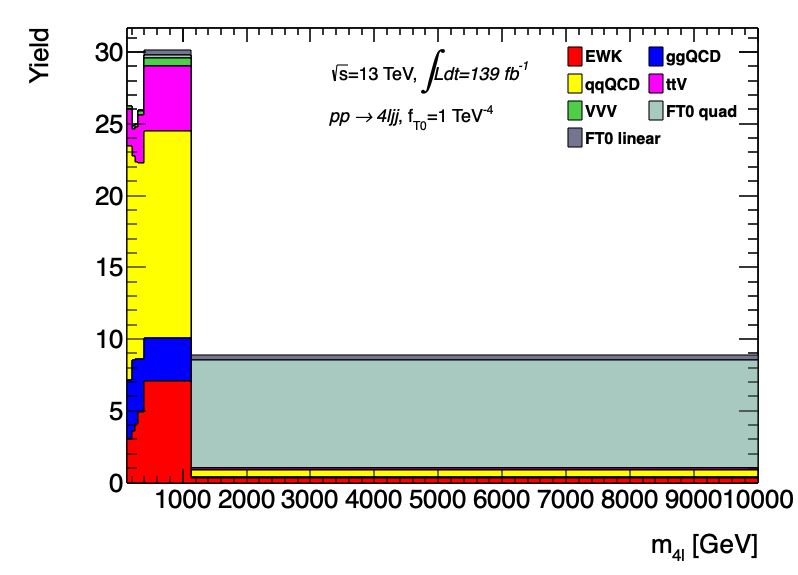
This is something that I want to do, mainly for aesthetic reasons. (see histo below)
It would also work for me, if I could remove the last bin and just draw the overflow, which can be done only when drawing TH1’s, as I learned here (/draw-overflow-bin/6610)
Thank you in advance,
Alexandros
Here is a piece of code that I’m using in order to draw the aforementioned THStack
void SampleAnalyzer::Draw_m4l(vector<vector<double>> list_of_obs_vectors, vector<vector<double>> list_of_weight_vectors)
{
	auto hs = new THStack("hs","m4l");
	TCanvas *c1 = new TCanvas("c1", "canvas_m4l", 800, 600);
	int m = list_of_obs_vectors.size();
	TH1F** h = new TH1F*[m];

	const Int_t Nbins = 6;
	Double_t edges[Nbins+1] = { 130, 210, 250, 304, 400, 1130, 10000 };


	for (int i = 0; i < list_of_obs_vectors.size(); i++)
	{
		//------------- Make multiple histograms to store multiple vectors --------------//
		h[i] = new TH1F(TString::Format("h0_%d", i), "m4l", Nbins, edges);
		for (int j = 0; j < list_of_obs_vectors[i].size(); j++)
		{
			h[i]->Fill(list_of_obs_vectors[i][j], list_of_weight_vectors[i][j]);
		}
		h[i]->Sumw2();
		hs->Add(h[i]);
	}

	c1->cd();


	h[0]->SetFillColor(2);
	h[1]->SetFillColor(4);
	h[2]->SetFillColor(5);
	h[3]->SetFillColor(6);
	h[4]->SetFillColor(8);
	h[5]->SetFillColor(29);
	h[6]->SetFillColor(39);


	// h[0]->GetXaxis()->SetRange(1,h[0]->GetNbinsX()+1);

	hs->Draw("hist");
   	hs->GetYaxis()->SetTitle("Yield");
   	hs->GetXaxis()->SetTitle("m_{4l} [GeV]");
   	// hs->GetXaxis()->SetLimits(500, 2000);

   	TLegend *leg = new TLegend(0.781059,0.728167,0.98167,0.9171);
   	leg->SetBorderSize(0);
   	leg->SetFillStyle(0);
   	leg->SetNColumns(2);
   	leg->SetTextSize(0.03);
   	TLatex latex;
   	latex.DrawLatex(0.68,0.9, "#splitline{#scale[0.7]{#sqrt{s}=13 TeV, #it{#intLdt=139 fb^{-1}}}}{#scale[0.7]{#it{pp #rightarrow 4ljj}, f_{T0}=1 TeV^{-4}}}");

   	leg->AddEntry(h[0],"EWK","F");
   	leg->AddEntry(h[1],"ggQCD","F");
   	leg->AddEntry(h[2],"qqQCD","F");
   	leg->AddEntry(h[3],"ttV","F");
   	leg->AddEntry(h[4],"VVV","F");
   	leg->AddEntry(h[5],"FT0 quad","F");
   	leg->AddEntry(h[6],"FT0 linear","F");
   	leg->Draw();

   	c1->Update(); c1->Modified();
   	gPad->Modified(); gPad->Update();
}
_ROOT Version: 6.24/06
_Platform: macosx64
Compiler: Not Provided