I am trying to optimize my analysis code written in ROOT, and after some profiling, I spotted there is a large memory consumption (~ 50 Mb) immediately after hist->GetXaxis()->SetBinLabel(…) is called.
You can reproduce this by compiling first the following trivial code snippet as a reference:
TProfile *tmp = new TProfile(“tmp”, “tmp”, 1, 0., 1.);
There is also a similar memory blow-up after cloning:
  TH1F *hist = new TH1F("hist", "", 1, 0., 1.); // memory is < 1 MB
  TH1F *histClone = (TH1F*) hist->Clone("histClone"); // memory blows up to > 50 MB
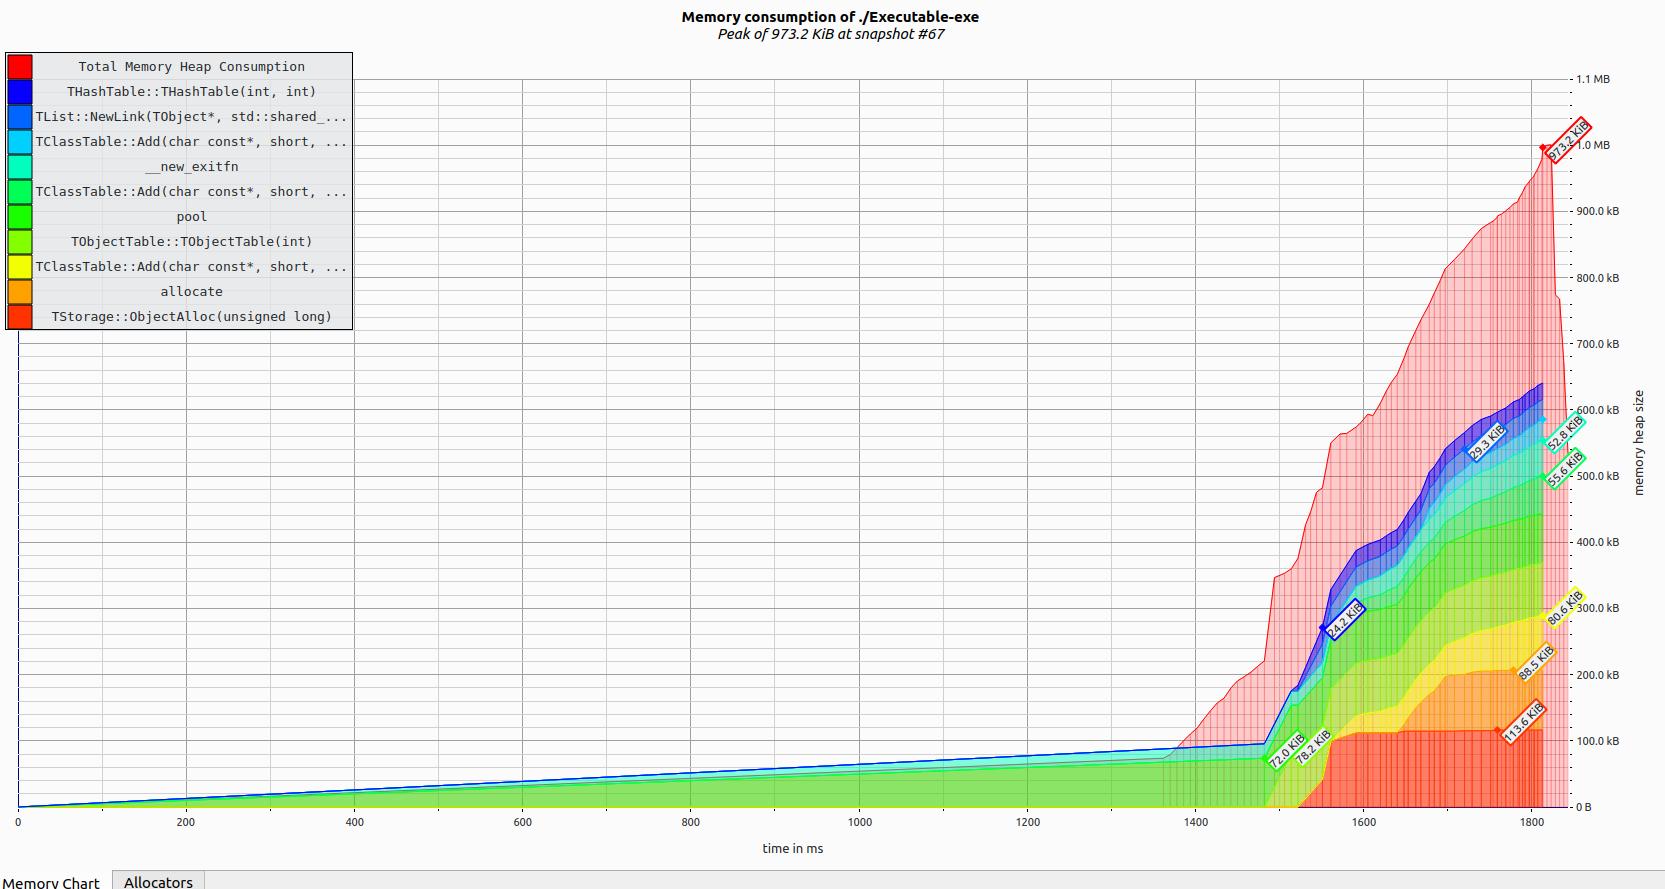
After looking at the source code of SetBinLabel(…), the blow-up reported in the very first thread can be further traced down to:
THashList *hlist = new THashList(1,3);
TObjString *obj = new TObjString("a"); // by this point memory is still < 1 MB
hlist->Add(obj); // after this step memory goes up by 50 MB
Since the blow-up in both cases is ~ 50 MB, it feels strongly that the underlying cause is the same, but i didn’t dig deeper into the ROOT source code to confirm this… I leave that investigation kindly to the ROOT experts!
I am done with the profiling of my analysis code, and I have a further feedback which might be helpful in this context.
There are several other classes which are affected, I can confirm TF1, TFormula, and TFile, in a sense that:
 TFile *file = new TFile("file.root", "new"); // memory blows up to > 50 MB
 file->Close(); delete file; file = nullptr; // memory is NOT released back

 TF1 *f1 = new TF1("f1", "sin(x)", 0., 1.); // memory blows up to > 50 MB
 delete f1; // memory is NOT released back
However, TH2D works as expected:
 TH2D *hist = new TH2D("hist", "", 100, 0., 100., 2000, 0., 2000.); // memory peaks at  ~2.5 MB
 delete hist; // memory is released back
It feels to me that everything is related to the underlying gROOT object, and all the automated bookkeeping it does behind the scene for some selected classes. Namely, even if I do not declare any object in my code, I can reproduce the problem with this trivial one-liner:
gROOT->GetListOfFunctions(); // memory blows up to > 50 MB
And perhaps the most extreme example:
std::cout << gROOT << std::endl; // memory blows up to > 50 MB
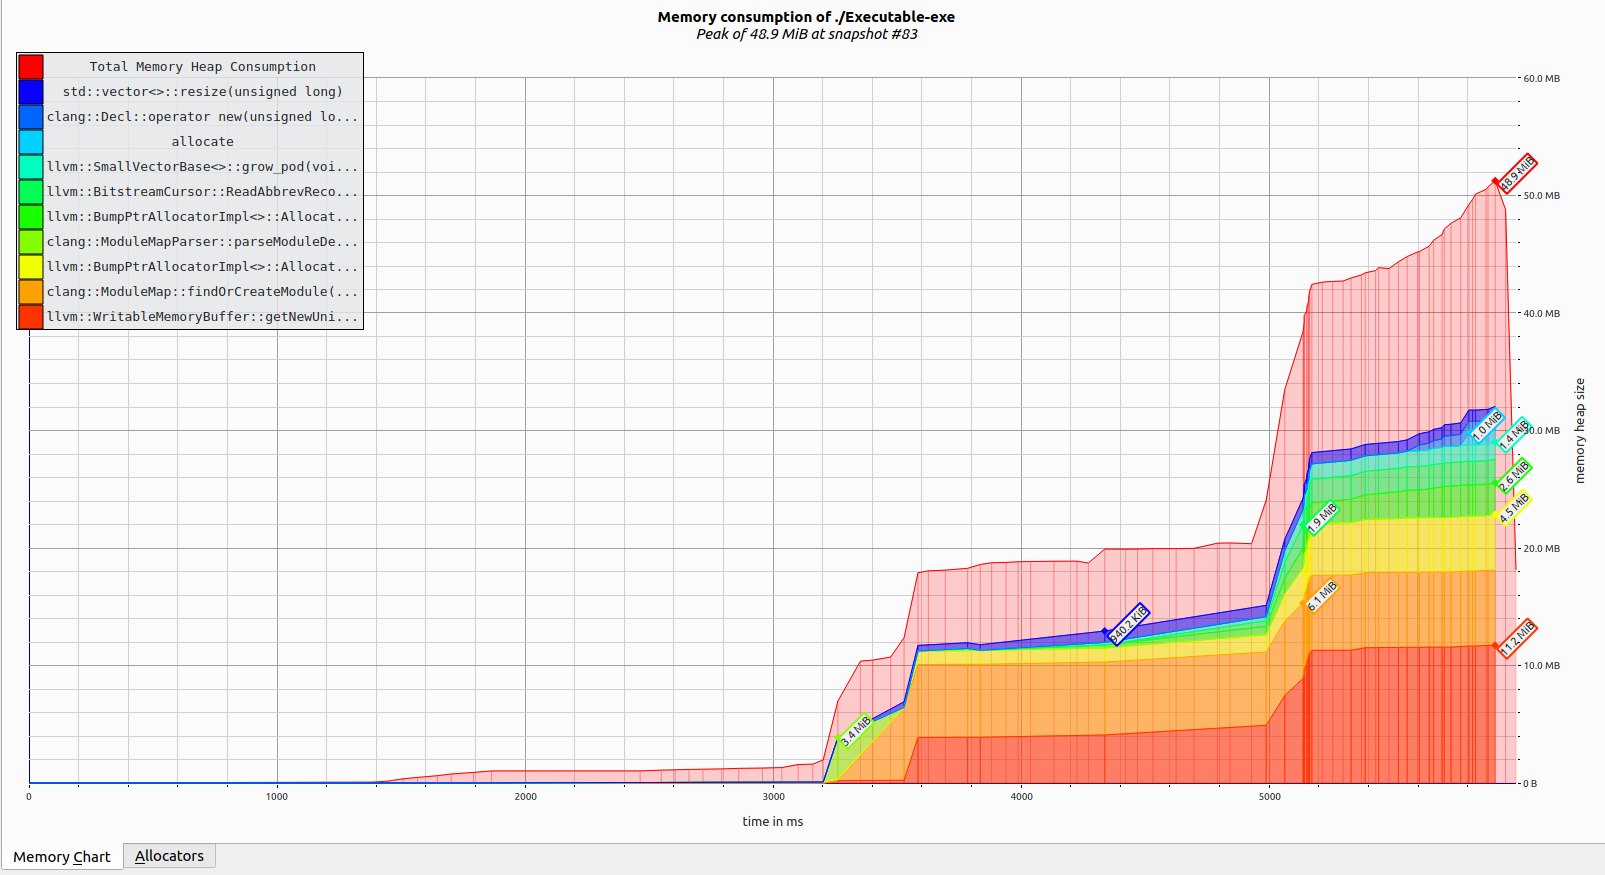
In ROOT master (debug), the "peak I see goes down until 24,9 MB, maybe thanks to some optimizations done recently by @hahnjo in template loading in llvm/clang/cling.
So I guess that when calling “gROOT”, cling gets initialized and all module-maps are being loaded. Maybe compiling with runtime_cxxmodules = off reduces this a bit?
Yes, the first time gROOT is called it the latest point until which we can delay the initialization of the ROOT environment which of course includes the interpreter (setting up the interpreter, creating the gInterpreter (TCling) object and this indeed requires the loading of a ‘minimal’ set of things which for the runtime_cxxmodules indeed includes attaching the module files. (Without runtime_cxxmodules instead we load the rootmap file and the contained forward declaration)
A quick hack is to rename the file /opt/root/include/ROOT.modulemap as “aaaa” and then the memory will go down from 34MB to 11MB in my setting calling gROOT. So at least 23 MB of the blowup are coming from the modules.
This of course may break things, but if you just want to call SetBinLabel, it might work.
You will get these errors printed though:
fatal error: module map file '/opt/root/include//ROOT.modulemap' not found
Replaced symbol at_quick_exit cannot be found in JIT!
Module ROOT_Foundation_C not found.
Module ROOT_Config not found.
Module ROOT_Rtypes not found.
Module ROOT_Foundation_Stage1_NoRTTI not found.
Module Core not found.
Module Rint not found.
Module RIO not found.
Module MathCore not found.
Module Hist not found.
Module Core not found.
Module Thread not found.
Module RIO not found.
Module TMVAGui not found.
Module TMVA not found.
Module ROOTTMVASofie not found.
Module PyMVA not found.
Module Genetic not found.
Module TMVAUtils not found.
Module Core not found.