I am using BDT to seperate my background and signal (which are stored in TTrees).
Assuming I have a pre-seperated sig and bg for the training of the tree, and also a mixed up samples for which i’d like to test the tree.
After the BDT is done I should be able to tell whether a specific event (e.g. entry=3400 in my mixed tree) is bg or sig, but how?
Also, I notice the BDT have a histogram (one for the training and one for the testing), how should I interpret this histogram?
After running your bdt each event will be associated with a score describing how signal-like the event is. If the score is close to 1 it is almost surly a signal. If it is close to 0 it is almost surly background. To determine if a given event is signal or background you can apply a cut on the output score.
E.g. you can run the event through the bdt and if the score is larger than let say 0.5 we consider it a signal.
I’m not entirely sure to which histogram you are referring, but in the TMVAGui there is one for output distribution. There you will see the bdt scores for both signal and background. From the above discussion, signal should tend to the right and background should tend to the left. Y-axis is how many events in your training/testing set that have a given output score.
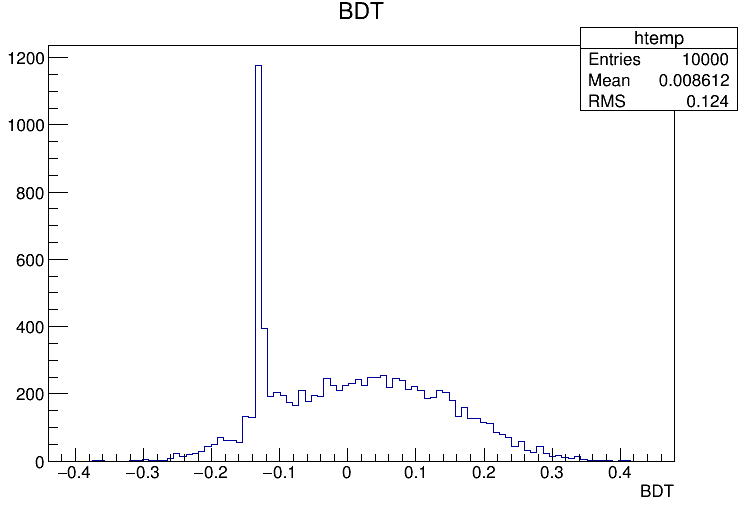
However, the BDT histogram I got is between -1 and 1, so I’m still not exactly sure what it means.
This is an example BDT histogram I printed from some tutorial:
The score of that particular bdt kind is then between -1 and 1. The same kind of reasoning applies.
Run an application of your classifier on the data. Check for example the TMVARegression.C example in tutorials/tmva. The output here will be an array, so you can investigate the score with some custom code.