JSROOT rendering differs from browser to browser

Hi! I have this MWE:

Summary
<!DOCTYPE html>
<html lang="en">
   <head>
      <meta charset="utf-8">
      <title>Test</title>
   </head>
   <body>
      <div id="drawing" style="width:800px; height:600px"></div>
   </body>
   <script type='module'>
      import { openFile, draw, create, createTGraph, createHistogram } from 'https://root.cern/js/7.5.2/modules/main.mjs';

      function CreateLegendEntry(obj, lbl, opt) {
        let entry = create('TLegendEntry');
        entry.fObject = obj;
        entry.fLabel = lbl;
        entry.fOption = opt;
        return entry;
      }

      let file0 = await openFile("https://root.cern/js/files/hsimple.root");
      let file1 = await openFile("https://root.cern/js/files/fillrandom.root");

      let h__file0 = await file0.readObject("hpx");
      let h__file1 = await file1.readObject("h1f");

      h__file0.fLineColor = 1;
      h__file1.fLineColor = 2;

      h__file0.fLineWidth = 4;
      h__file1.fLineWidth = 4;

      const npoints = 5;
      let xpts=[-5, -2, 0, 2, 5];
      let ypts=[20, 50, 100, 45, 15];
      let exp_data = createTGraph(npoints, xpts, ypts);
      exp_data.fMarkerSize = 1.5;
      exp_data.fMarkerStyle = 20;

      let h1 = createHistogram('TH1I', 20);
      h1.fName = 'axis_draw';
      h1.fTitle = "Title";
      h1.fXaxis.fTitle = "Xaxis";
      h1.fYaxis.fTitle = "Yaxis";
      h1.fYaxis.fXmin = 0;
      h1.fYaxis.fXmax = 150;
      h1.fXaxis.fXmin = -10;
      h1.fXaxis.fXmax =  10;
      draw("drawing", h1, "NOSTAT");

      draw("drawing", h__file0, "C same");
      draw("drawing", h__file1, "C same");
      draw("drawing", exp_data, "P");
      let leg = create('TLegend');
      Object.assign(leg, { fX1NDC: 0.2, fY1NDC: 0.75, fX2NDC: 0.6, fY2NDC: 0.9 });
      leg.fPrimitives.Add(CreateLegendEntry(h__file0, 'hpx', 'L'));
      leg.fPrimitives.Add(CreateLegendEntry(h__file1, 'h1f', 'L'));
      leg.fPrimitives.Add(CreateLegendEntry(exp_data, 'data', 'P'));


      draw("drawing", leg);
   </script>
</html>

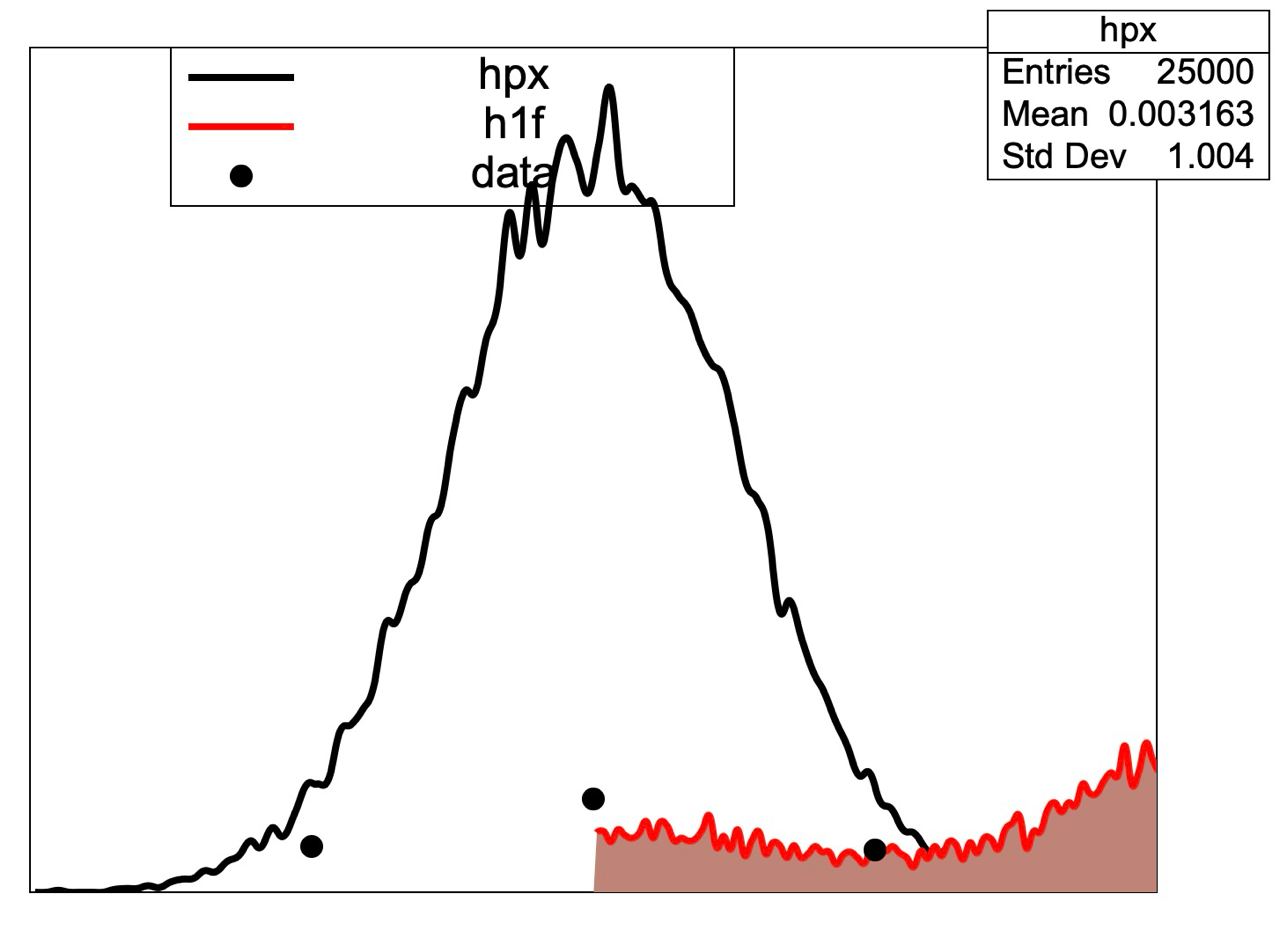
This is how it renders in Safari:

Summary

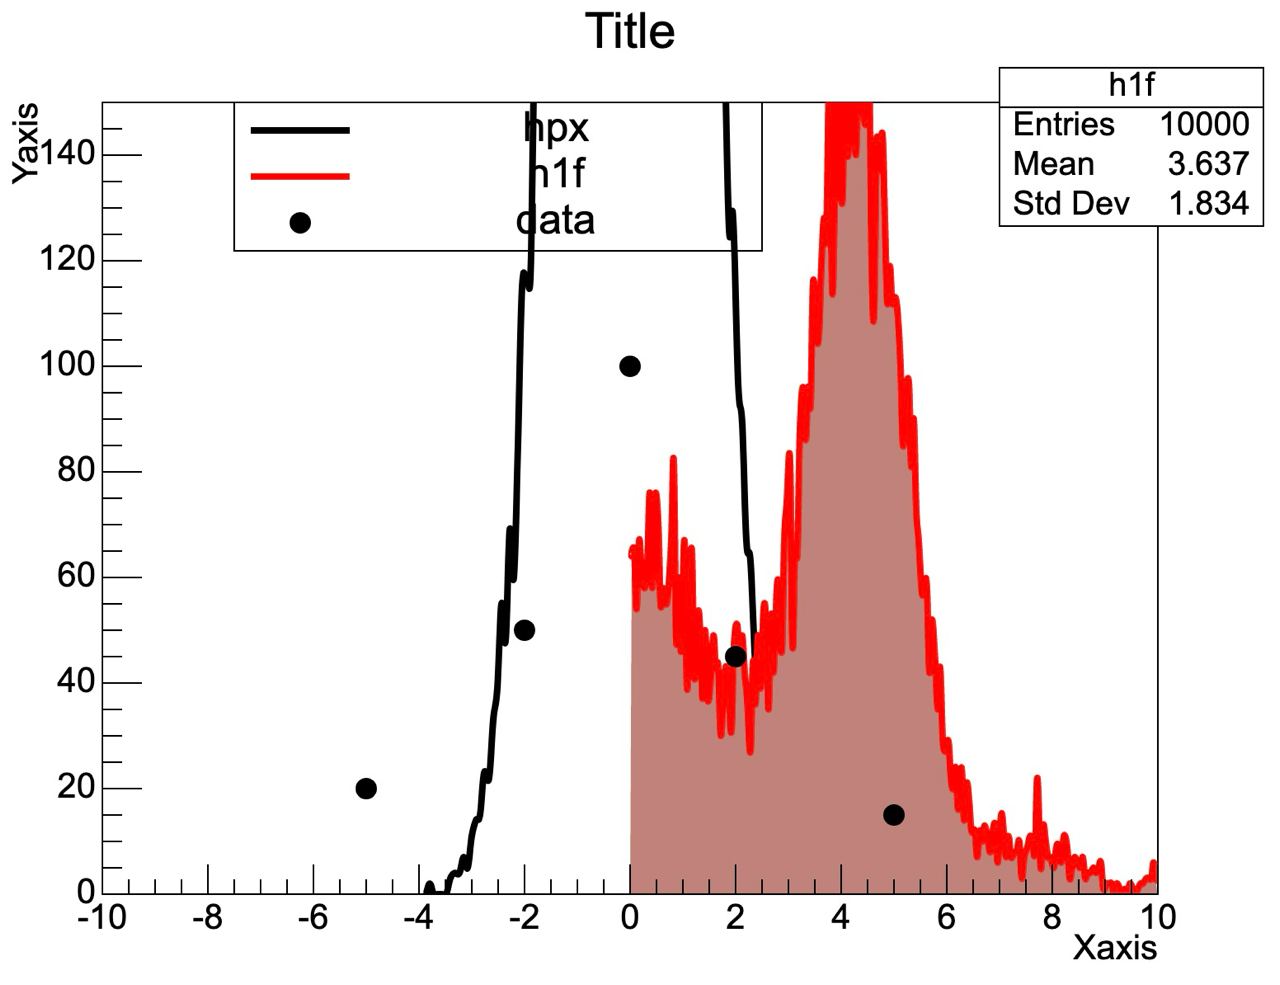
And this is in Firefox:

Summary

So, how to ask JSROOT to always make the same results?

Hi,

Can you check developer console in Safari?
Seems to be some failure happens there - which prevent JSROOT from drawing histogram axes.

Unfortunately, JSROOT is not tested with Safari and therefore such kinds of errors may appear.

Regards,
Sergey

Hi!

Just checked, but there are no errors in the Safari console except some minor about favicon:

Not allowed to load local resource: file:///favicon.ico

I also asked my colleague to check this MWE.
So, I have Firefox 119 and 120 on MacOS and Linux respectively – the result is like on the picture in the first post. My colleague has Firefox 115 and TLegend is missing in that case.

It is bug in JSROOT. You should see it in the browser console.
I will fix it in next 7.5.3 version.

For the moment just set fName for TLegend:

 let leg = create('TLegend');
 Object.assign(leg, { fX1NDC: 0.2, fY1NDC: 0.75, fX2NDC: 0.6, fY2NDC: 0.9, fName: 'TPave' });

By mistake it was marked as title.

There is also another problem which I did not recognize from the beginning.

You should wait until drawing is performed for each object. Most easy way:

      await draw("drawing", h1, "NOSTAT");
      await draw("drawing", h__file0, "C same");
      await draw("drawing", h__file1, "C same");
      await draw("drawing", exp_data, "P");
      let leg = create('TLegend');
      Object.assign(leg, { fX1NDC: 0.2, fY1NDC: 0.75, fX2NDC: 0.6, fY2NDC: 0.9, fName: 'TPave' });
      leg.fPrimitives.Add(CreateLegendEntry(h__file0, 'hpx', 'L'));
      leg.fPrimitives.Add(CreateLegendEntry(h__file1, 'h1f', 'L'));
      leg.fPrimitives.Add(CreateLegendEntry(exp_data, 'data', 'P'));
      await draw("drawing", leg);

Thank you! await fixed the behaviour for Safari.