Hello ROOT community,
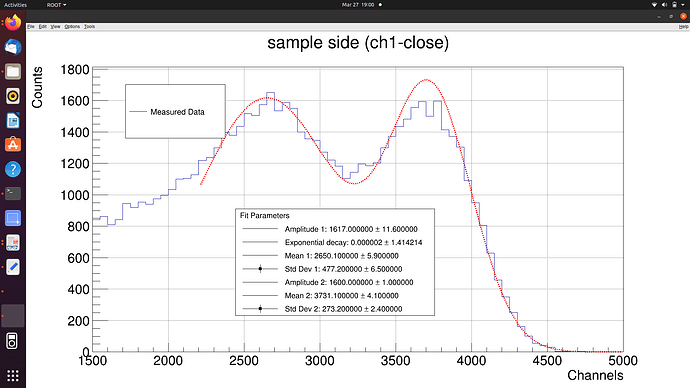
I am currently working on a project where I need to fit a double Gaussian function to my data. However, I am encountering an issue with the fitted amplitude for one of the peaks(right pick). I would appreciate any guidance or suggestions on how to resolve this problem.
Here’s the code I’ve been using for fitting:
cpp
TF1 *fit = new TF1("fit", "[0]*TMath::Gaus(x, [2], [3]) + [4]*TMath::Gaus(x, [5], [6])", 2200, 5000);
The issue I’m facing is that the fitted amplitude for the second peak (parameter [4]) appears to be incorrect. Visually, the fit amplitude seems to be around 1740, but the fitting result gives me p4 = 1600. I am unsure why this discrepancy occurs and would like some advice on how to correct it.
So far, I have considered the following possible explanations:
- Initial parameter values: Perhaps the initial parameter values are too far from the actual values, causing the fit to converge to a local minimum instead of the global minimum.
- Fit range: The fitting range (2200 to 5000) might be inappropriate for my data, affecting the accuracy of the fit.
- Convergence issues: The fitting process might not have converged properly, requiring an increase in the number of iterations, a change in the minimization algorithm, or an adjustment of the tolerance.
- Complexity of the fit function: The fit function might be too complex or not suitable for my data, leading to incorrect results.
I would greatly appreciate any suggestions, tips, or best practices for resolving this issue. If you need any additional information or clarification, please let me know.
Thank you in advance for your help!
script:
#include “TROOT.h”
#include “TFile.h”
#include “TTree.h”
#include “TBrowser.h”
#include “TH2.h”
#include “TRandom.h”
void close_side_ch1_exp_gaus_fit()
{
// Open a ROOT file containing a TTree of data to be plotted
TFile *f1 = new TFile(“SDataF_CH1@N6725SB_16973_15Dec_run_1_each.root”, “read”);
// Get the TTree named "Data_F" from the ROOT file
TTree *t1 = (TTree*)f1->Get("Data_F");
// Declare variables to hold data from TTree branches
UShort_t channel, energy;
ULong64_t timestamp;
// Set the TTree branches to point to the declared variables
t1->SetBranchAddress("Energy", &energy);
t1->SetBranchAddress("Channel", &channel);
t1->SetBranchAddress("Timestamp", ×tamp);
// Define a cut to select data with energy greater than 700
TCut cut = "Energy >= 1500";
// Create a 1D histogram to hold the data
TH1D *histo = new TH1D("histo","sample side (ch1-close)",100,0,5000);
// Fill the histogram with the selected data
t1->Draw("Energy>>histo", cut);
// Create a canvas to draw the histogram and fit
TCanvas *c1 = new TCanvas();
// Create grid to the canvas
c1->SetGridx();
c1->SetGridy();
// Set the axis titles and sizes of the histogram
histo->GetXaxis()->SetTitle("Channels");
histo->GetYaxis()->SetTitle("Counts");
histo->GetXaxis()->SetTitleSize(0.04);
histo->GetYaxis()->SetTitleSize(0.04);
histo->GetXaxis()->SetLabelSize(0.04);
histo->GetYaxis()->SetLabelSize(0.04);
// Cancell the stats bar
histo->SetStats(0);
t1->Draw("Energy>>histo", cut);
histo->GetXaxis()->SetRangeUser(1501, 5000);
// Define a fit function with two Gaussian peaks
TF1 *fit = new TF1("fit", "[0]*TMath::Gaus(x, [2], [3]) + [4]*TMath::Gaus(x, [5], [6])", 2200, 5000);
// Set the line width and style of the fit function
fit->SetLineWidth(3);
fit->SetLineStyle(2);
// Set the initial values and limits for the fit parameters
fit->SetParameter(0, 1600); // Amplitude of the first peak
fit->SetParameter(1, 0.000002); // Exponential decay of the convolved Gaussian-Exponential
fit->SetParameter(2, 2600); // Mean of the first peak
fit->SetParLimits(2, 2400, 2800);
fit->SetParameter(3, 500); // Standard deviation of the first peak
fit->SetParLimits(3, 0, 600);
fit->SetParameter(4, 1650); // Amplitude of the second peak
fit->SetParLimits(4, 1600, 1700);
fit->SetParameter(5, 3730); // Mean of the second peak
fit->SetParameter(6, 300); // Standard deviation of the second peak
// Draw the histogram on the canvas again to overlay the fit
histo->Draw();
// Draw the histogram on the canvas again to overlay the fit
histo->Fit("fit", "R");
// Create a legend for the plot and add entries for the data and fit function
TLegend *leg = new TLegend(0.15,0.7,0.3,0.85);
leg->SetBorderSize(1);
leg->AddEntry(histo, "Measured Data", "l");
//leg->AddEntry(fit, "Fit Function", "l");
leg->Draw();
// Add entries for the fit parameters with error bars
TLegend *legend = new TLegend(0.6, 0.6, 0.9, 0.9);
legend->SetBorderSize(1);
legend->SetHeader("Fit Parameters");
legend->AddEntry("fit", ("Amplitude 1: " + std::to_string(std::round(fit->GetParameter(0)*10.0)/10.0) + " #pm " + std::to_string(std::round(fit->GetParError(0)*10.0)/10.0)).c_str(), "l");
legend->AddEntry("fit", ("Exponential decay: " + std::to_string(fit->GetParameter(1)) + " #pm " + std::to_string(fit->GetParError(1))).c_str(), "l");
legend->AddEntry("fit", ("Mean 1: " + std::to_string(std::round(fit->GetParameter(2)*10.0)/10.0) + " #pm " + std::to_string(std::round(fit->GetParError(2)*10.0)/10.0)).c_str(), "l");
legend->AddEntry("fit", ("Std Dev 1: " + std::to_string(std::round(fit->GetParameter(3)*10.0)/10.0) + " #pm " + std::to_string(std::round(fit->GetParError(3)*10.0)/10.0)).c_str(), "lep");
legend->AddEntry("fit", ("Amplitude 2: " + std::to_string(std::round(fit->GetParameter(4)*10.0)/10.0) + " #pm " + std::to_string(std::round(fit->GetParError(4)*10.0)/10.0)).c_str(), "l");
legend->AddEntry("fit", ("Mean 2: " + std::to_string(std::round(fit->GetParameter(5)*10.0)/10.0) + " #pm " + std::to_string(std::round(fit->GetParError(5)*10.0)/10.0)).c_str(), "l");
legend->AddEntry("fit", ("Std Dev 2: " + std::to_string(std::round(fit->GetParameter(6)*10.0)/10.0) + " #pm " + std::to_string(std::round(fit->GetParError(6)*10.0)/10.0)).c_str(), "lep");
legend->Draw();
}
