lata
November 19, 2021, 7:10pm
1
Dear experts,
I am trying to produce a similar plot given at [1]. Although I am able to plot 2D histogram with colz option, I am not able to understand that how the highlighted histogram with red lines, in this plot, should be drawn over this 2D histogram. Could you please give me a hint or an example?
Thanks,
Lata
[1] http://cms-results.web.cern.ch/cms-results/public-results/publications/HIG-20-014/CMS-HIG-20-014_Figure_006.png
Please read tips for efficient and successful posting and posting code
ROOT Version: Not ProvidedPlatform: Not ProvidedCompiler: Not Provided
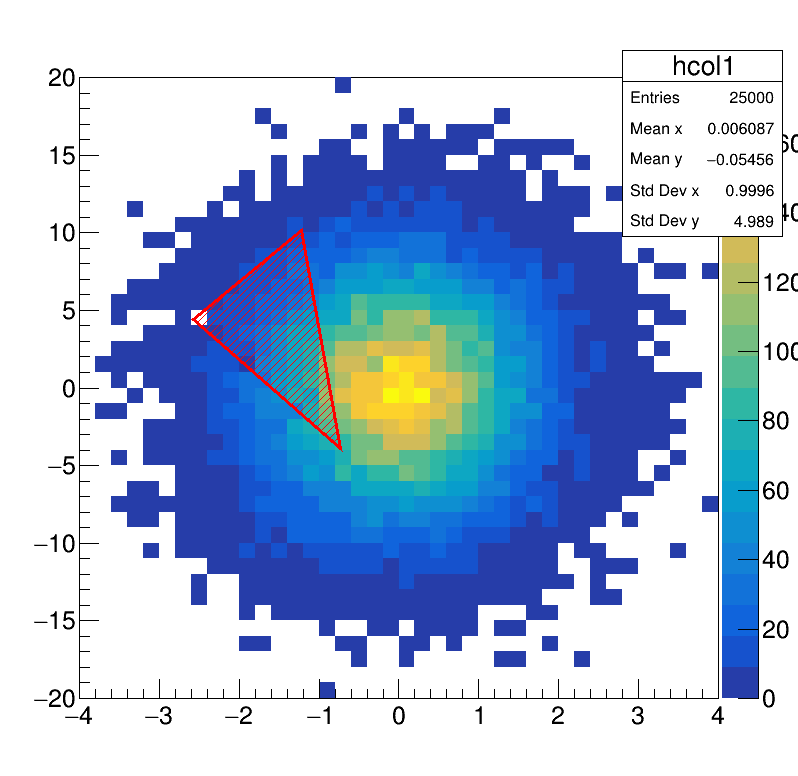
Use a TCutG .
{
TCanvas *c = new TCanvas("c1","c1",800,800);
TH2F *hcol1 = new TH2F("hcol1","",40,-4,4,40,-20,20);
float px, py;
for (Int_t i = 0; i < 25000; i++) {
gRandom->Rannor(px,py);
hcol1->Fill(px,5*py);
}
hcol1->Draw("COLZ");
TCutG *cutg = new TCutG("mycut",4);
cutg->SetVarX("x");
cutg->SetVarY("y");
cutg->SetFillColor(2);
cutg->SetFillStyle(3004);
cutg->SetLineColor(2);
cutg->SetLineWidth(3);
cutg->SetPoint(0,-2.575251,4.411765);
cutg->SetPoint(1,-1.220736,10.16043);
cutg->SetPoint(2,-0.735786,-3.877005);
cutg->SetPoint(3,-2.575251,4.411765);
cutg->Draw("L F"); // Line (perimeter), Fill
return;
}

lata
November 21, 2021, 1:28pm
4
Thanks, @dastudillo for the quick response. It worked perfectly.
Gary896
November 23, 2021, 4:20am
5
I have also same issue any suggestion for this so please reply.
