I recently discovered ROOT and it seems very powerful.
It can do multiplatform graphics and handle a lot of data which is what I need.
However before embarking into a journey on Root I would like to be sure it can do all what I want. So here is a brief description
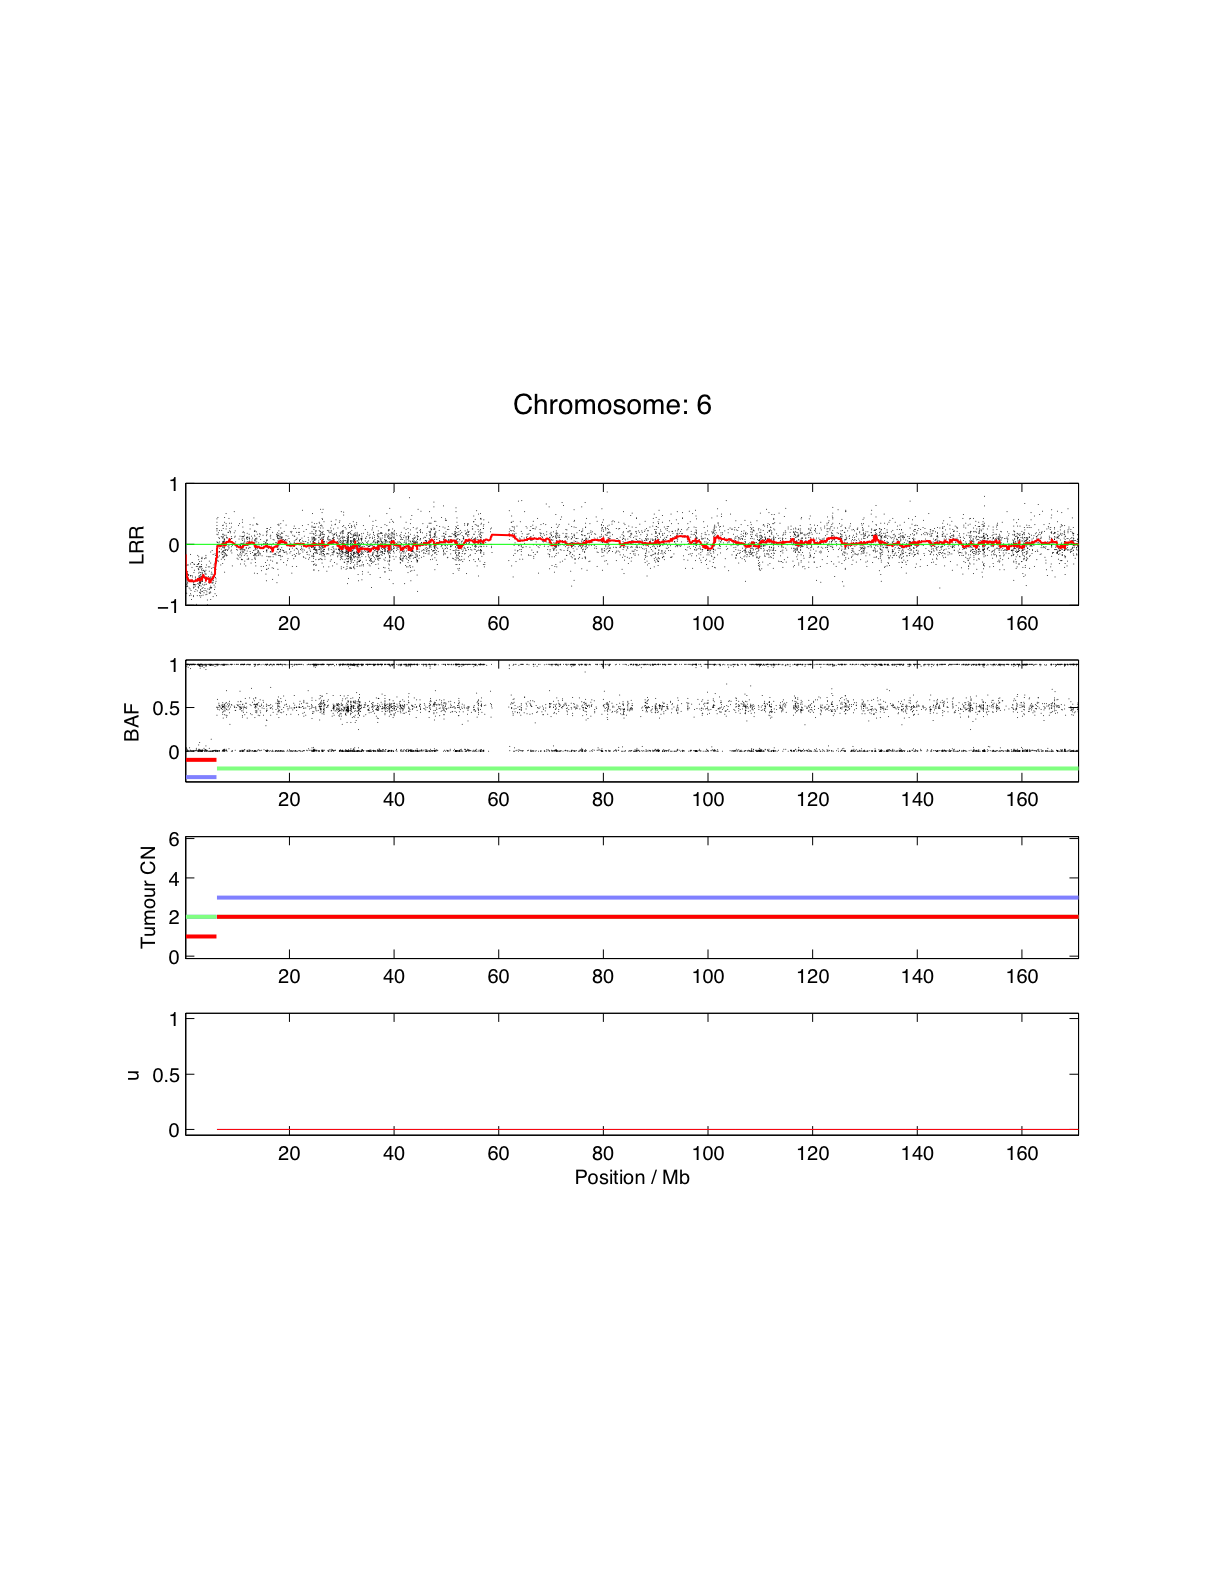
I work in the field of genetics and recent technology brings us much larger amount of data than we could ever imagine. Navigating (including zooming), in 2D, through the genome and integrating difference source of information is becoming very important and I would therefore like to develop an interactive and Integrative Graphical interface. Attached is the type of picture I want to explore with a couple of million points for each plot.
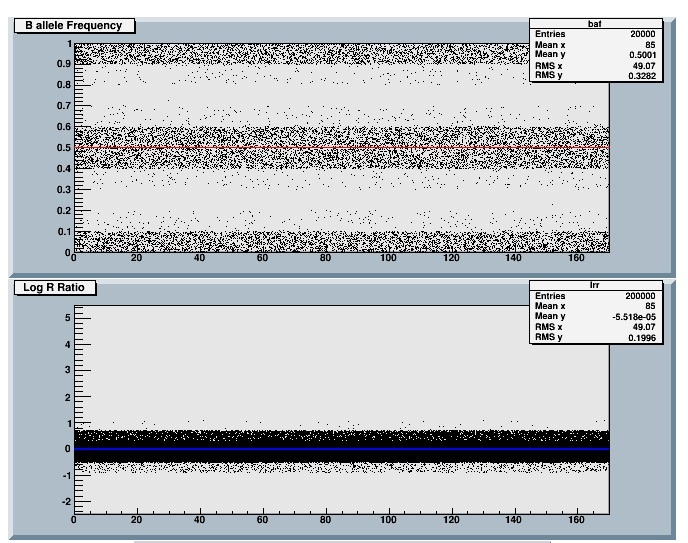
It should be trivial with ROOT. You can try for example the small script below that creates a histogram, fill it with 2 million points and draw it.
zooming on the x axis takes about 0.1 s
Rene
void lrr() {
   TH2F *hlrr = new TH2F("hlrr","Chromosome",170,0,170,20,-1,1);
   TRandom3 r;
   for (int i=0;i<2000000;i++) {
      hlrr->Fill((int)r.Uniform(0,170),r.Gaus(0,0.2));
   }
   hlrr->Draw();
}
It seems that you have created the enclosed image with R to display data from Affymetrix mapping arrays (package GenomeGraphs?)?
Thus I would suggest to look at my package “xps” which is based on ROOT to store all Affymetrix expression data, and which you can download from the BioConductor web-site. The vignette “xps.pdf” has an appendix about “ROOT graphics”, see: bioconductor.org/packages/2. … oc/xps.pdf
In my personal opinion ROOT class TTree is the best way to store huge amounts of data (e.g. Affymetrix CEL-files), which you can then analyze even on computers with limited amounts of RAM.
For a very nice example on the power of interactive ROOT graphics have a look at example “DynamicSlice.C”. After changing to directory “root/tutorials/hist” and starting root you can simply type “.x DynamicSlice.C”. Move the mouse over the 2D-histogram and enjoy.
I tried your little code and it works like a charm.
I could even make it 3D by pushing some button, although I am not sure what it corresponds to.
I noticed that I can zoom both from the X and Y axis. Would it be possible to have a selection box in case I want both X and Y ? This is specially true of I want to select one of the graph at the same time.
Thanks again
Jebbie
[quote=“brun”]It should be trivial with ROOT. You can try for example the small script below that creates a histogram, fill it with 2 million points and draw it.
zooming on the x axis takes about 0.1 s
Rene
void lrr() {
   TH2F *hlrr = new TH2F("hlrr","Chromosome",170,0,170,20,-1,1);
   TRandom3 r;
   for (int i=0;i<2000000;i++) {
      hlrr->Fill((int)r.Uniform(0,170),r.Gaus(0,0.2));
   }
   hlrr->Draw();
}
[/quote]
Thanks for this detailed answer. It seems we have similar issues with our data and come to similar solutions.
Well it is not Affymetrix mapping array, but very close to it.
So indeed your suggestions for data storage will prove very valuable.
Very interesting tool eventhough I do not deal with expression data at the moment.
So it seems I am not the first person in Genetics to consider ROOT as a very useful way to manipulate the array data.
[quote=“cstrato”]
For a very nice example on the power of interactive ROOT graphics have a look at example “DynamicSlice.C”. After changing to directory “root/tutorials/hist” and starting root you can simply type “.x DynamicSlice.C”. Move the mouse over the 2D-histogram and enjoy.[/quote]
This application is very nice indeed. But I can see other application for it in Metabonomics rather than this one.
Following the advices above, I have started to develop my application using Root.
I m now trying to decide which data structure will be most efficient as I deal with very large dataset. However, as the 2 previous posts refer to TH2F and TTree I am unsure on which one to use.
Here is a (simplified) description of my data:
1000 samples
Each Sample has 23 Chromosomes
Each chromosome has 20 000 markers
Each marker has got a location and various values: 4 floats, 3 Int and 2 Strings.
I usually use data for each sample/chromosome plotting many of the values using the common Location for X-axis.
Would you advise me to use TTree, TH1F or a combination of both ?
Answering your question requires to know a bit more about what you want to do with your data,
what is the query profile.
-Do you always have 1000 samples?
-Do you always have 23 chromosomes per sample
-Do you always have 20000 markers per chromosome?
[quote=“brun”]Answering your question requires to know a bit more about what you want to do with your data,
what is the query profile.
-Do you always have 1000 samples?
-Do you always have 23 chromosomes per sample
-Do you always have 20000 markers per chromosome?
Rene[/quote]
I did not realize more would be needed.
This data will essentially be used to navigate through (by zooming) as shown in the picture on chromosome at a time. But having access to summary statistics, such as distribution, modes, etc could be useful too.
No the number of samples can be very variable. 1000 is more on the upper limit. Even if I would like to keep all in memory to jump from one to the other, I should look at only a couple of them at a time.
Yes. I would often focus on 1 chromosome in particular, but sometimes visualising (scatter X/Y and summary stat) the whole genome would be of interest too.
No. Each chromosome will have a different length, averaging 20,000 but it will be fixed across samples for the same chromosome.
I am not sure if Rene will agree with me but I would strongly recommend, that you store all your data first as TTree in TFile,
and use TTree as starting point for any drawing, e.g. using tree->Draw().
Storing all your data as trees has also the advantage that you can define how to store your data in trees.
This will make you independent of the file structure of the different mapping array providers such as Affymetrix or Illumina,
because after importing these data into your trees, you can develop your follow-up code independent of the original file structure.
of course I agree with you that the solution is a TTree, but I was hoping to propose a simple example if I knew the type of queries. May be you can help him a bit since you are in the same field :
Thus, I think Jean-Baptiste wants to create an IGB which is both interactive and fast.
However, this will become a major project, but ROOT is obviously the system of choice.
You are indeed spot on. Or almost, because I do not want to recreate what already exists.
As my original post described, I want to navigate this data fast because that is the limitation of today’s tools.
But this navigation is only part of the software I am writing because my main goal is to compare results obtained from these large dataset. I already implemented this main part on a web-based application I already wrote. But I want now to create a stand-alone application as well as be able to come back to this Large original data to better understand the analysis. i.e. click on a segment and see the corresponding raw data.
In a sense, the project is not that big, because it is essentially porting to Root my existing tool and use Root to extend its ability.
I have already started to grow some Ttrees following the cern staff example and it seems to work well with structures. I am still struggling a bit with the usefulness of branches. But it is Spring after all.
I will hopefully show more enlightening graphs soon as I gather up new questions