Hello,
I am kind of new to root, especially to RooFit, which poses a great challenge for me. I have made a fit of a data set with a composite Model PDF consisting of several BreitWigner and a polynomial background. Now I need to integrate just one of these BreitWigner PDFs. I tried to do this with simply using BreitWigner.createIntegral(x), but this does not seem to work, since the BreitWigner PDF itself is not fitted (the fractions are not being included, if I do it this way). When I plot the components with model.plotOn(frame,Components(BreitWigner)) it looks alright, but I would need a function like model.createIntegral(x,Components(BreitWigner)) which I do not find in the class reference.
Can anybody help me with my problem? Thanks.
What you can do is create a `https://root.cern.ch/doc/master/classRooExtendPdf.html’ using the BreitWigner pdf and the fitted number of events. If you are fitting the fraction, this value is just the product of the total number of events multiplied by the fitted fraction.
Then you can create the integral of this class.
First of all, thank you very much for your answer. As a first step to implementing your solution, I tried to build such an RooExtendPdf from the whole composite Pdf and integrate over it in order to simply get back the number of events.
RooRealVar Norm(“Norm”,“Normalization”,PlusHist->GetEntries());
RooExtendPdf modelextend(“ExtendedModel”,“Model extended by number of events”,modelbkg,Norm);
RooAbsReal* CountAll = modelextend.createIntegral(mass);
(Legend: PlusHist is the histogram containing all events, modelbkg is the pdf and mass is my axis).
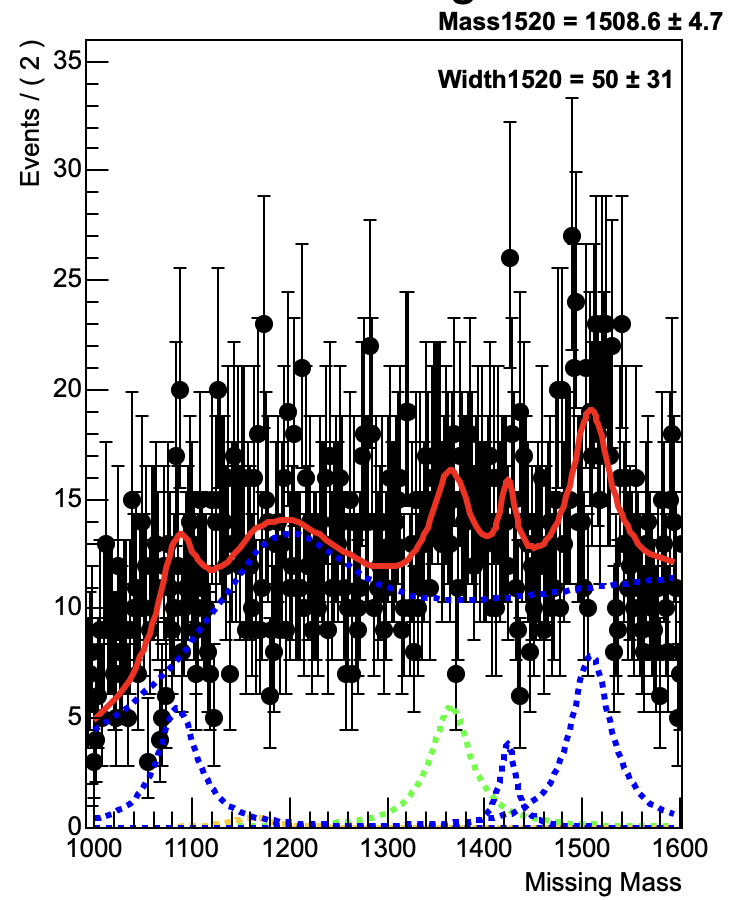
I included a picture of my fit and the data from PlusHist. Estimating the result of the integral, it should be over 7500 (value about 15 over a range of about 500), but the result is a value of about 700, which I do not understand.
But maybe my problem is rather in the understanding of this .createIntegral() than in using it. Doesn’t it simply return the value of the integral of the red line I see in the plot?
Hopefully, this is all not too confusing expressed and you understand my difficulties.
Thanks
Hi,
Yes, you are right, the RooExtendPdf computes the integral of your modelPdf.
But what is your goal, compute the integral in a different range than the normalisation range ? Otherwise the integrals of all pdf’s are equal to 1 by definitions
My final goal would be to integrate the blue curve at about 1500 as it is seen in the picture.
As a check I tried to integrate the red curve. Since I know that the histogram had about 7000 Entries, I would expect the integral of the red curve to be approximately this value. The way I integrate written down in my previous post. This lead to a result about 600 which is why I do not understand right.
What contributes to my confusion is the fact, that my (rather unprecise) calculation of the integral of the red curve (value about 15 in an area of 500 = 7500) leads to a result which I would expect too.
Therefore I do not think, that the curve that I can see in the plot is integrated but rather some sort of pdf.
I finally understood my mistake. There really are just 618 Entries, but each entry of course corresponds to a number. What I wanted to have was the sum of these numbers, which I called Entries (wrongly so). Thus my problem is solved and I wholeheartedly apologize to have bothered you with such a rather hasty mistake of me.
Anyway thank you for your support throughout this process.