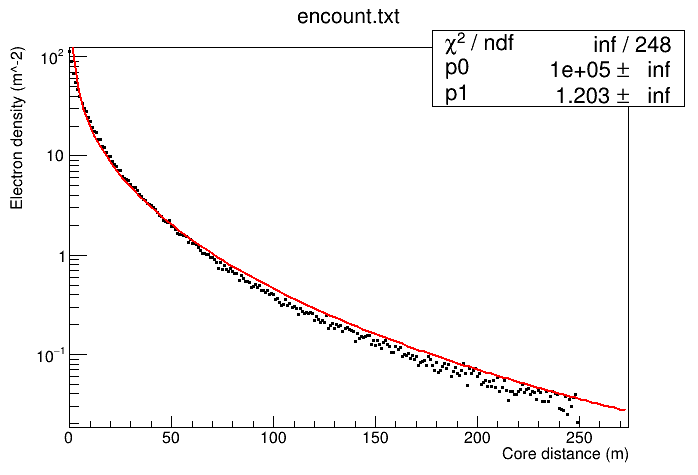
Thanks @dastudillo for replying! I understand why it is infinity but now when I changed my data to start from x=1 rather than x=0, the fitting is not looking nice. Please see attached.
@dastudillo
But why is that by changing x from 0 to 1, the fit goes wrong. In the previous case it was passing nicely through the points but now it’s not?
The output from the first fit said that it failed, so that line was not a proper fit to your function; if that one looked fine, maybe you need to change something in your fit.
@dastudillo The function that I’m using to fit is ‘NKG’ function, a standard function to describe how lateral density varies with core distance. The data points are generated by using a simulation. So I can neither modify the function nor the data points. So what should I change?
Dear chrisbgd,
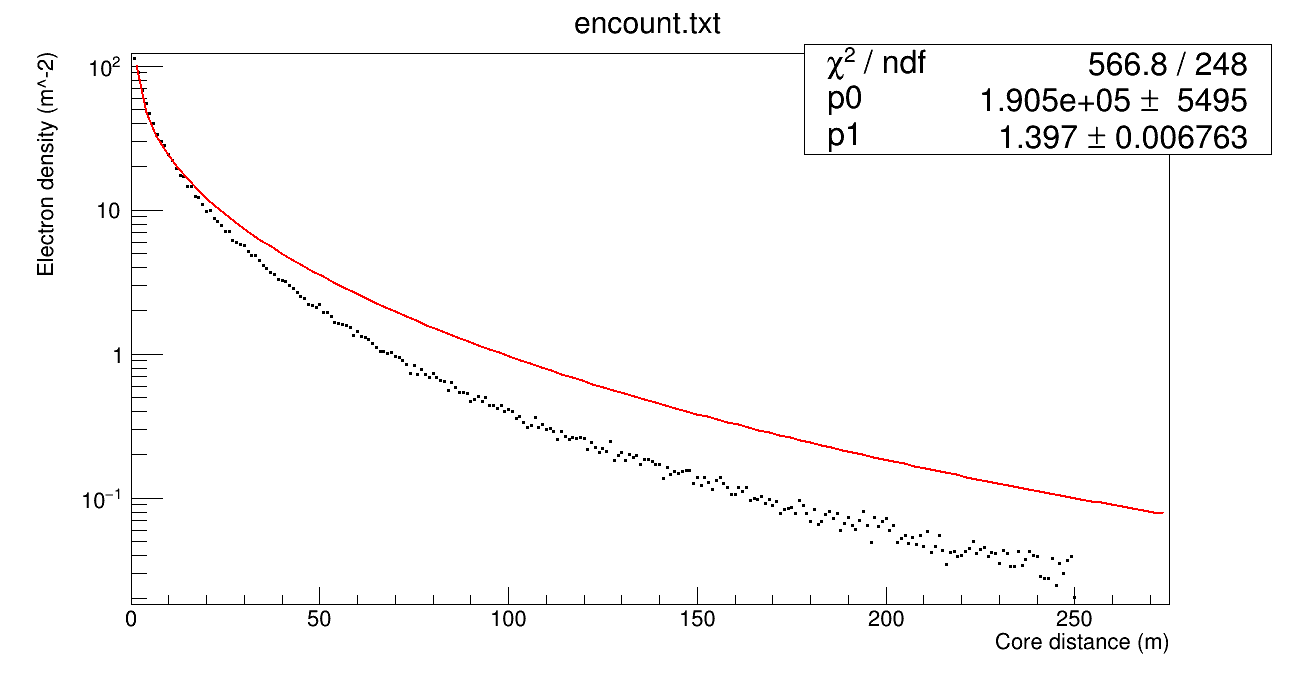
it seems there is a problem with your simulation, please check it. Normally the simulated data points should be distributed uniformly around the curve of the function, used to generate the points. The figure from your first post shows that points are below the curve at x>50 and x<5, and above the curve at 10<x<40.
@Wile_E_Coyote I’m sure you must have seen the NKG function. There are actually only 3 parameters in the NKG function Ne, s and rM. In my case, I have directly put the value of rM (moliere radius) instead of taking it as a parameter because it is known for that particular geographical place and that’s why my curve was not coming out right. On the other hand, you’ve taken it as a parameter and it spits out that value for which the curve is fitting well, but the problem now is this value of rM is not correctly matching with the calculated one.
So the question that really needs to be asked is why my simulated points are not generated correctly such that they fit the NKG function for rM=103. It may be due to wrong input of parameters, which I doubt, but needs to be checked.