Incorrect Legend in RooFit fit plot

_ROOT Version:_6.24
Platform: Ubuntu 20.04

I am generating random numbers to fill a histogram h. Then, I try to fit a Gaussian on h using RooFit. When I add the Legend, the fit curve is represented as Histogram points and the points with error bars as Fit curve here as shown in the figure. I want the opposite.

#include “RooRealVar.h”
#include “RooDataSet.h”
#include “RooGaussian.h”
#include “TCanvas.h”
#include “RooPlot.h”
#include “TAxis.h”

using namespace RooFit;

void gausfit()
{
double n = 10000.0; //No. of points
double x, y;
double mean = 0, sdev = 5;
TCanvas *c1 = new TCanvas();

TH1F *h = new TH1F(“hist”, “Random Gaussian Fit”, 100, -20, 20);

/Generate Random numbers from a Gaussian Fit/
TRandom2 *rnd = new TRandom2(2);
for(int i = 0; i < n; i++)
{
h → Fill(rnd->Gaus(mean, sdev));
}

/Find a Gaussian Fit for the Randomly generated numbers/
double meanfit = h → GetMean(), sdevfit = h → GetStdDev();
RooRealVar xfit(“x”, “X”, -20, 20);
RooDataHist xx(“dx”, “dx”, xfit, Import(*h));
RooRealVar newmean(“Mean”, “Mean of gaussian”, meanfit, -30, 30);
RooRealVar newsigma(“sigma”, “Gaussian width”, sdevfit, 0, 10);

RooGaussian gauss(“gauss”, “Gaussian fit”, xfit, newmean, newsigma);

RooPlot *xfitframe = xfit.frame();
xx.plotOn(xfitframe);

gauss.plotOn((xfitframe));

h → GetXaxis()->SetTitle(“X”);
h → GetYaxis()->SetTitle(“Frequency”);

xfitframe → Draw();

TLegend *l = new TLegend(0.6,0.6,0.8,0.8);
l → AddEntry(h, “Histogram points”);
l → AddEntry(xfitframe, “Fit Function”);
l → Draw();

}

Can someone suggest where am I going wrong? Also, is there a shorter way of fitting randomly generated numbers using RooFit?

Thank You

I don’t use RooFit, so there may be other/better solutions, but you can try something like this:

{
double n = 10000.0; //No. of points
double x, y;
double mean = 0, sdev = 5;
TCanvas *c1 = new TCanvas();

TH1F *h = new TH1F("hist", "Random Gaussian Fit", 100, -20, 20);

//Generate Random numbers from a Gaussian Fit
TRandom2 *rnd = new TRandom2(2);
for(int i = 0; i < n; i++) {
  h -> Fill(rnd->Gaus(mean, sdev));
}

//Find a Gaussian Fit for the Randomly generated numbers/
double meanfit = h -> GetMean(), sdevfit = h -> GetStdDev();
RooRealVar xfit("x", "X", -20, 20);
RooDataHist xx("dx", "dx", xfit, Import(*h));
RooRealVar newmean("Mean", "Mean of gaussian", meanfit, -30, 30);
RooRealVar newsigma("sigma", "Gaussian width", sdevfit, 0, 10);

RooGaussian gauss("gauss", "Gaussian fit", xfit, newmean, newsigma);

RooPlot *xfitframe = xfit.frame();

xx.plotOn(xfitframe,LineWidth(2),LineColor(kGreen),MarkerColor(kGreen),MarkerSize(1));
h -> GetXaxis()->SetTitle("X");
h -> GetYaxis()->SetTitle("Frequency");
h->SetLineColor(kGreen);
h->SetLineWidth(2);
h->SetMarkerColor(kGreen);
h->SetMarkerStyle(20);

gauss.plotOn(xfitframe,LineColor(kRed));
TH1F *h2 = new TH1F("h2","h2",1,0,1);
h2->SetLineColor(kRed);
h2->SetLineWidth(2);

xfitframe -> Draw();

TLegend *l = new TLegend(0.6,0.6,0.8,0.8);
l -> AddEntry(h, "Histogram points", "LP");  // "LP" = show line and polymarker as symbol
l -> AddEntry(h2, "Fit Function", "L");
l -> Draw();

}

Checking the documentation, you need to add the draw options when calling plotOn, and use the TGraph draw options, described in TGraphPainter.
For the legend, I supposed these should work:

l -> AddEntry("dx", "Histogram points", "LP");
l -> AddEntry("gauss", "Fit Function", "L");

since they should take the drawing options used when they were added, but they actually use some default format; so using “h” was a workaround, and I did the same for “gauss”, creating h2 just so we can take its formatting for the legend entry; just note that the line and marker formats of h and h2 must match those of dx and gauss, respectively.

1 Like

Thanks for the response.

I tried another thing. Instead of the 4 lines where I am designing the Legend, I just wrote

gPad → BuildLegend();

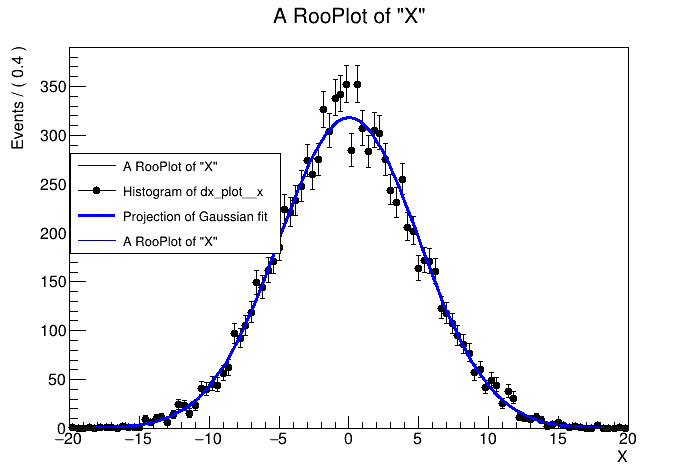
This identified the markers correctly but it is giving two extra entries in the Legend. Do you know why?