_ROOT Version:_6.24
Platform: Ubuntu 20.04
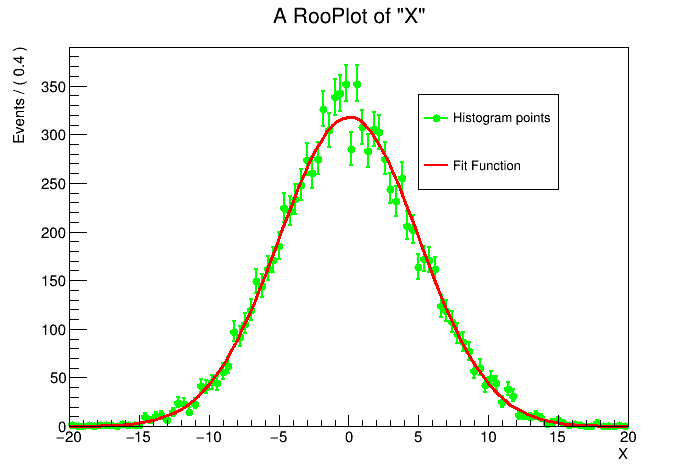
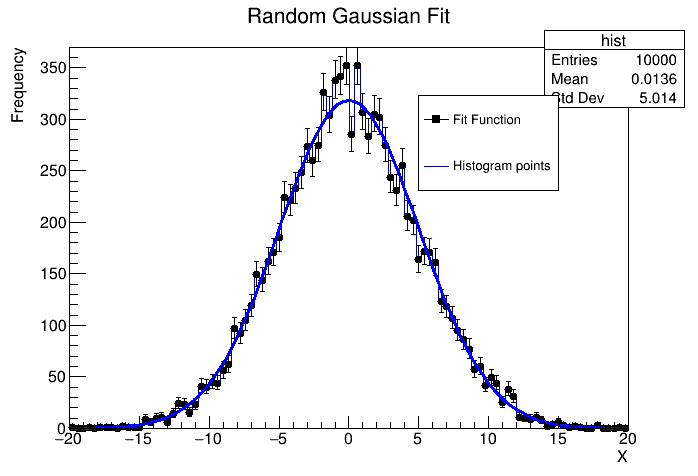
I am generating random numbers to fill a histogram h. Then, I try to fit a Gaussian on h using RooFit. When I add the Legend, the fit curve is represented as Histogram points and the points with error bars as Fit curve here as shown in the figure. I want the opposite.
#include “RooRealVar.h”
#include “RooDataSet.h”
#include “RooGaussian.h”
#include “TCanvas.h”
#include “RooPlot.h”
#include “TAxis.h”using namespace RooFit;
void gausfit()
{
double n = 10000.0; //No. of points
double x, y;
double mean = 0, sdev = 5;
TCanvas *c1 = new TCanvas();TH1F *h = new TH1F(“hist”, “Random Gaussian Fit”, 100, -20, 20);
/Generate Random numbers from a Gaussian Fit/
TRandom2 *rnd = new TRandom2(2);
for(int i = 0; i < n; i++)
{
h → Fill(rnd->Gaus(mean, sdev));
}/Find a Gaussian Fit for the Randomly generated numbers/
double meanfit = h → GetMean(), sdevfit = h → GetStdDev();
RooRealVar xfit(“x”, “X”, -20, 20);
RooDataHist xx(“dx”, “dx”, xfit, Import(*h));
RooRealVar newmean(“Mean”, “Mean of gaussian”, meanfit, -30, 30);
RooRealVar newsigma(“sigma”, “Gaussian width”, sdevfit, 0, 10);RooGaussian gauss(“gauss”, “Gaussian fit”, xfit, newmean, newsigma);
RooPlot *xfitframe = xfit.frame();
xx.plotOn(xfitframe);gauss.plotOn((xfitframe));
h → GetXaxis()->SetTitle(“X”);
h → GetYaxis()->SetTitle(“Frequency”);xfitframe → Draw();
TLegend *l = new TLegend(0.6,0.6,0.8,0.8);
l → AddEntry(h, “Histogram points”);
l → AddEntry(xfitframe, “Fit Function”);
l → Draw();}
Can someone suggest where am I going wrong? Also, is there a shorter way of fitting randomly generated numbers using RooFit?
Thank You