_ROOT Version: JupyROOT 6.24/06
_Platform: Linux Ubuntu 20.04
_Compiler: Python 3.9.7
Hello,
While fitting cdf function, I come across incorrect drawing of the fit, the parameters however are correct (checked in Iminuit).
Creating Ttree:
t = ROOT.TTree("t", "Tree");
t.ReadFile("dane.csv", "Y/F:X/F");
g1 = ROOT.TGraph(t.GetSelectedRows(),t.GetV2(), t.GetV1())
Fitting looks like this:
%jsroot on
c2 = ROOT.TCanvas()

func = ROOT.TF1("func","ROOT::Math::lognormal_cdf(x,[0],[1])")

func.SetParLimits(0,0,10)
func.SetParLimits(1,0,10)
func.SetParNames ("m","s");

wynik = g1.Fit(func,"MES", "", 0, 10000)
g1.Draw()
c2.SetLogx()
ROOT.gStyle.SetOptFit();
c2.Draw()
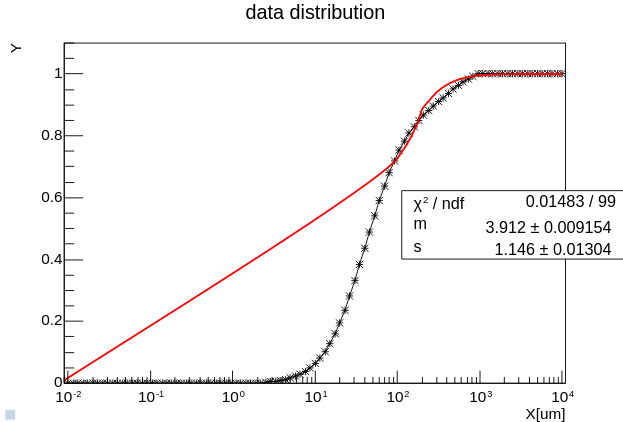
As you can see the graph is just bad, but calculated parameters are fine.
The problem comes from the fact that fitting line has step of drawing 100, which results in creation of fitting line points 0, 100, 200 and so on, skipping everything that is in between.
It is for sure because of X axis has large range <0, 10000>.
The conclusion is that i don’t really know how to fix this. Changing parameters steps is useless because they are fine. I tried to search for answers reading most of documentation about fitting classes but haven’t found anything useful.
Ps. Quick fix of this is to fit 3 functions in different ranges like <0,20>, <20,1000>, <1000, 10000>, but besides being ugly, parameters are wrong.
(Can’t upload program and data because of “new user”)