Dear Rooters,
I’m trying to display an ROC curve in 2D using CONT4Z. I use as input data from an ascii file (x,y,z). TGraph2D and TH2F both display incorrect palette range and bin values. Altering the bin size does not solve the problem.
Any help would be appreciated.
For input file see sample.txt (9.0 KB)
For script see:
#include "Riostream.h"

void Sample_2() {
gStyle->SetOptStat(0);
gStyle->SetPalette(1);

   ifstream in;
   in.open("sample.dat");

// First use TGraph2D constructor to see what plot looks like:
   TCanvas *c1 = new TCanvas("c1"," ",0,0,700,350);
   c1->SetFrameFillColor(TColor::GetColorPalette(0));
   c1->SetFrameFillColor(4);
   c1->Divide(2,1);
   c1->cd(1);
   TGraph2D *g1 = new TGraph2D("sample.dat");
   g1->Draw("cont4z");

// Next repeat process by reading in ascii file into 2D histo and plotting
   c1->cd(2);
   Float_t x,y,z;
   Int_t nlines = 0;

   TH2F *h2 = new TH2F("h2","Same data but using 2DHisto",40,0,1,40,0,1);

   while (1) {
      in >> x >> y >> z;
      if (!in.good()) break;
      h2->Fill(x,y,z);
      nlines++;
   }
   in.close();
   h2->SetContour(10);
   h2->SetMinimum(150);
   h2->SetMaximum(250);
   h2->Draw("CONT4Z");
   c1->Update();
}
For script output see
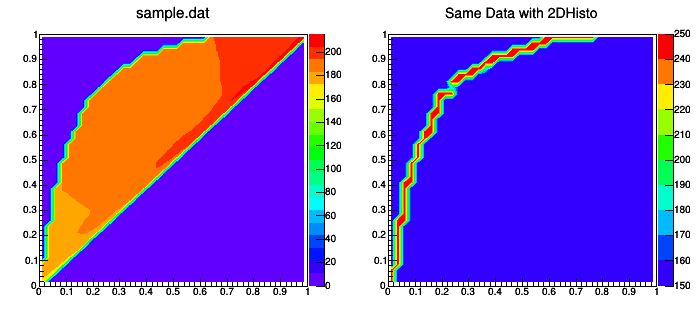
The plot on the left is generated with TGraph2D. It is totally wrong, the Z scale and the interpolation between points. The plot on the right is better but also wrong. Z ranges from 160 to 215 (see attached text file) and increases as one moves towards the top right of the plot. Also, is there a way to set bins with value below a cut-off to be white, for example bins with values < 160 == white?
many thanks in advance