Improving fitting

Hello all,

I am struggling to fit a function.having four parameters to a set of 5 data points

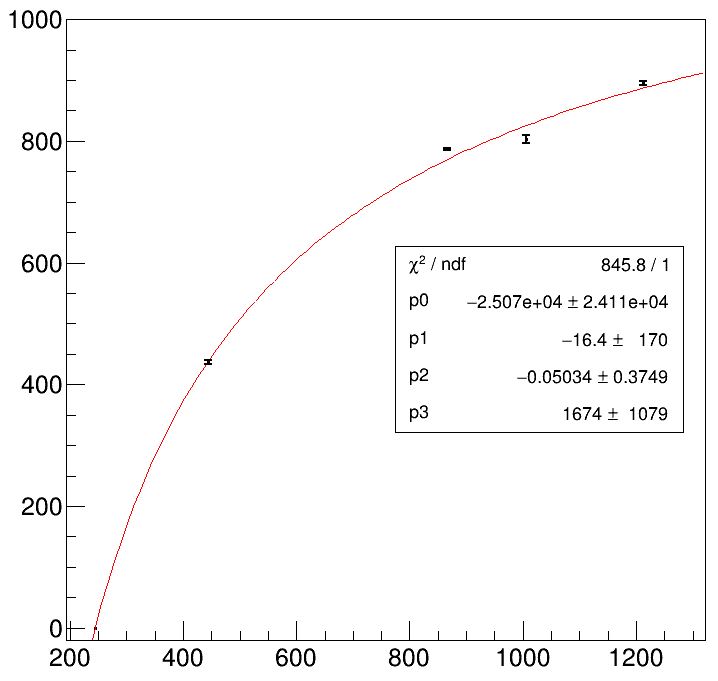
The key issue I am trying to resolve is the abnormally hight chi^2 value of 845

The minimizer is Minuit / Migrad
Chi2                      =      845.817
NDf                       =            1
Edm                       =  2.51652e-07
NCalls                    =           77
p0                        =     -25071.4   +/-   24111.9     
p1                        =     -16.4008   +/-   169.97      
p2                        =   -0.0503403   +/-   0.37486     
p3                        =      1673.53   +/-   1079.4      
Fit is valid!
Fit Status:0

Can someone please help in improving the fit quality and reducing he chi^2 ?Here is the macro if it helps


void fit(){
	
  	gStyle->SetEndErrorSize(4.0);
	
	TCanvas *c1 = new TCanvas("c1","c1",800,800);
	
	const int n = 5;

        double x[n]= {244.1, 444, 867,  1005, 1213};
	double y[n]= {0, 437, 787, 803, 895};
        double err_y[n] = {0, 3, 2, 7, 4};

	TF1 *func = new TF1("fitf","[3] + [2]*x + [0]/TMath::Sqrt(x + [1])", 0, 1400);
	func->SetParameter(0, -25071);
	func->SetParameter(1, -16.399);
	func->SetParameter(2, -0.050344);
	func->SetParameter(3, 1673.55);
	func->SetLineWidth(1);
	
   
	auto g = new TGraphErrors(n,x,y,nullptr, err_y);
	g->SetMarkerStyle(7);
	g->SetMarkerSize(3);
	g->SetLineWidth(2);
	TFitResultPtr r = g->Fit(func, "WRS");
	
	//Fit Validity
	Int_t fitStatus = r;
	if (r->IsValid())  std::cout << "Fit is valid!" << std::endl;
	else std::cout << "Fit is not valid!" << std::endl;
  	cout << "Fit Status:" << r << endl;
  	
  	g->Draw("AP");
  	g->GetXaxis()->SetRangeUser(200, 1400);
	g->GetYaxis()->SetRangeUser(-20, 1000);

	gStyle->SetOptFit(111);
	
}

Thanks a lot for your time and considertaion

Hi @utkarsh-2000,

thanks for your question, maybe @moneta could help?

Cheers,
Marta

I can see that your array x contains the gamma-ray energies from 152Eu source
and the array y is corresponding channel numbers of histogram/ADC.
I don’t understand how can you get 244 keV at channel no. 0!

I suggest you to first take a look at your data set, including errors, which appear unrealistic to me.

Thanks a lot for the reply.
Sorry, this is a bit different from the “calibration curve” used for transforming channel numbers to energies. The Y axis is with reference to the value at 244 keV, hence the 0.

Please feel free to share any suggestions and/or information from my side.
Thank You

Hello,
I think there is no much you can do to improve the fitting given the data. I think the curve you are getting is when you are not using the W option (ignore error in y). With option W, I am getting an horizontal line as
fitted function. I think you should provide better estimates for your y error. In particular you cannot have an error of 0 in your first data point.

Lorenzo

Hi,
Thanks a lot for your suggestion.

Yes, correct. Sorry, I forgot to update the macro accordingly.

I’ll try getting some better estimates for errors in the y-axis and get back.

Thank You