Hi,
I am trying to make comparison of some already published data with my results. For which I need to extract data (Gaussian shaped histograms mainly). So what I do is I extract the X and Y data points from a graph and I re-plot using the method discussed in " Unable to display the histogram entries and standard deviation". When I do this I really wonder how the errors are calculated by root say, for the mean and standard deviation.
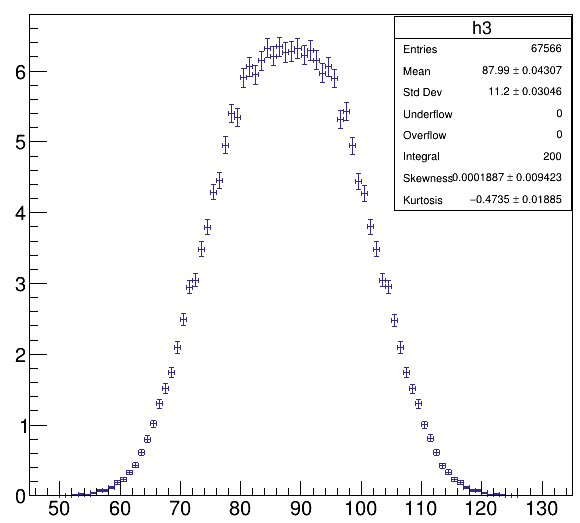
As for understanding better, I have histogram from a ttree which I am attaching below:
So i extracted the data points and I replotted the data using the method described in “Unable to display the histogram entries and standard deviation”. Please see below :
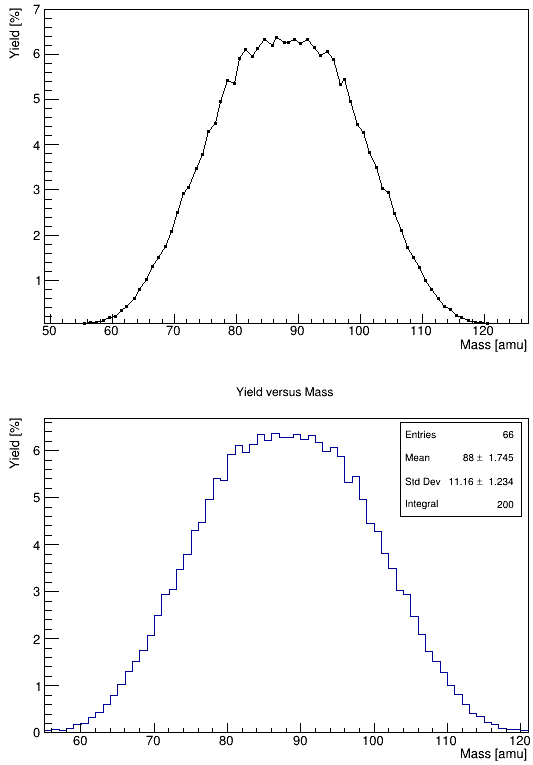
As you can see from the plots the error obatined when I replotted the data is quite different from the true error which the data has.
Can anyone tell me how to resolve this problem. How can I obtain the correct errors when I replot the data point.
Any insights about the error calculation in root would be really helpful.
Thanking you for the kind consideration!
