Dear All,
I have two TGraphs and would like to draw them to the same pad to check correlations.
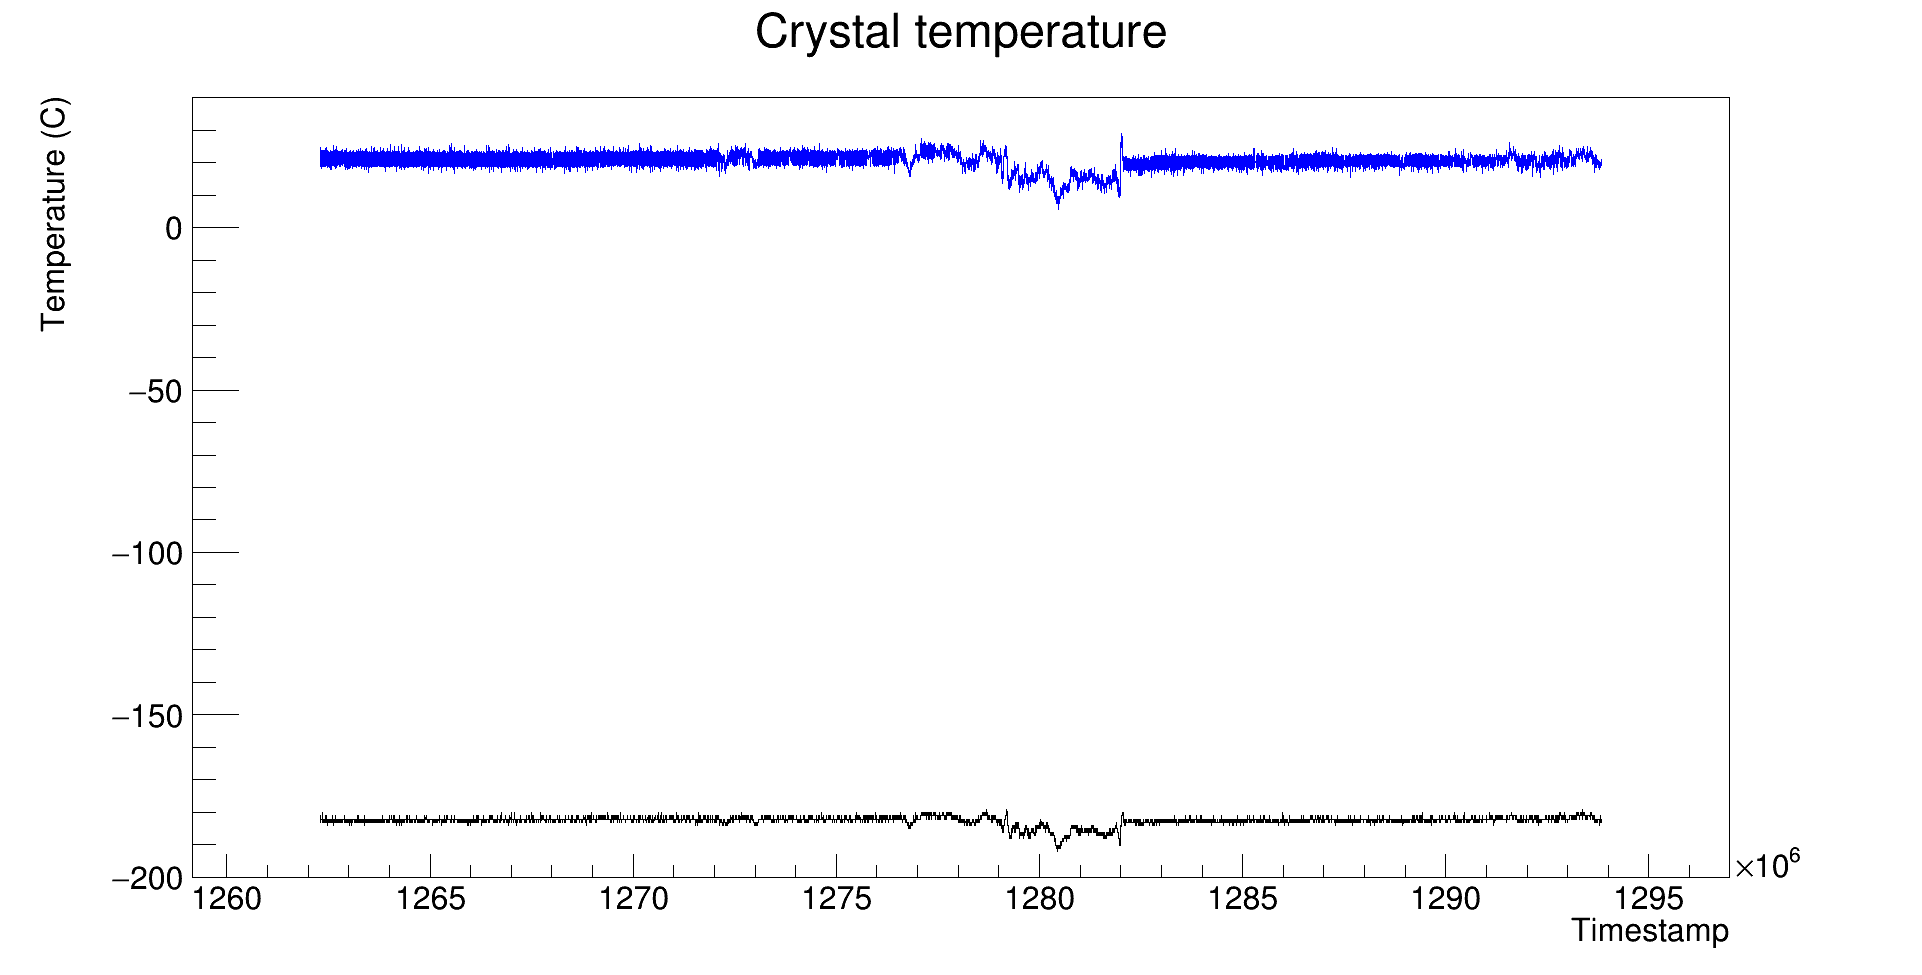
The problem is that their Y values are in different ranges. How is it possible to use different Y axes for the two TGraphs? The black shoud be between -200 and -170, the blue between 0 and 30. I found some examples for histograms, but I can not apply them for TGraphs.
Source code and data file attached.
Thank you for your help.
draw.C (1.2 KB)
histos.root (428.8 KB)