Hi @hschindl ,
I have a follow-up question. At the moment, this is how I am simulating a track from the incident beam:
  TrackHeed track;
  track.SetSensor(&sensor);
  track.SetParticle("proton");
  track.SetKineticEnergy(20.e6);

  double xc = 0., yc = 0., zc = 0., tc = 0., ec = 0., extra = 0.;
  int nc = 0;
  std::vector<double> electrons;
  double xe = 0., ye = 0., ze = 0., te = 0., ee = 0.;
  double dx = 0., dy = 0., dz = 0.;
  int left=0, right = 0;
  int NofProton = 100;
  for (int i = 0; i < NofProton; i++) {
    // Simulate a track
    track.NewTrack(-x, 1.0, -x, 100., 1., 0., 1.); //45 degrees
		while (track.GetCluster(xc, yc, zc, tc, nc, ec, extra)) {
			for (int k = 0; k < nc; ++k) {
			  track.GetElectron(k, xe, ye, ze, te, ee, dx, dy, dz);
			  electrons.push_back(xe);
			  electrons.push_back(ye);
			  electrons.push_back(ze);
			  electrons.push_back(te);
			}
		}
  }
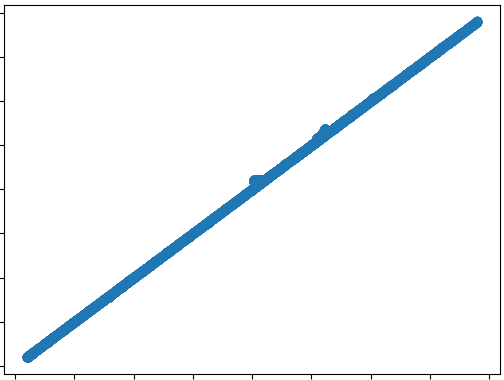
When NofProton = 1, I get a rather straight track, like below:
However, when NofProton = 100, the track becomes this
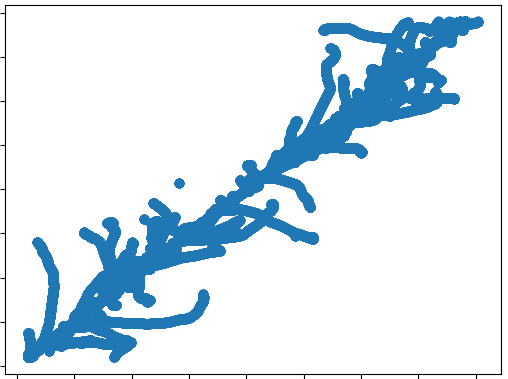
Can you please explain to me why this is happening?
Note: each tick mark corresponds to 1 cm.