Hi @couet the script generates its own data. I created greyscale in the palette editor and saved it. I have just commented out line 42
TImage *img1 = TImage::Open("/Users/cashcrusaders/Documents/cluster/Archive/cluster.jpg");
refers to some image I do not have.
Oh ok my apologies. I have just removed lines 195-200
I ran your macro.
I see it generates two csv file.
What is wrong ?
It should also generate a TCanvas that contains these three plots.c1|596x500 . So what I am trying to do is generate a grey scale image of the plot on the bottom left like the one in this image
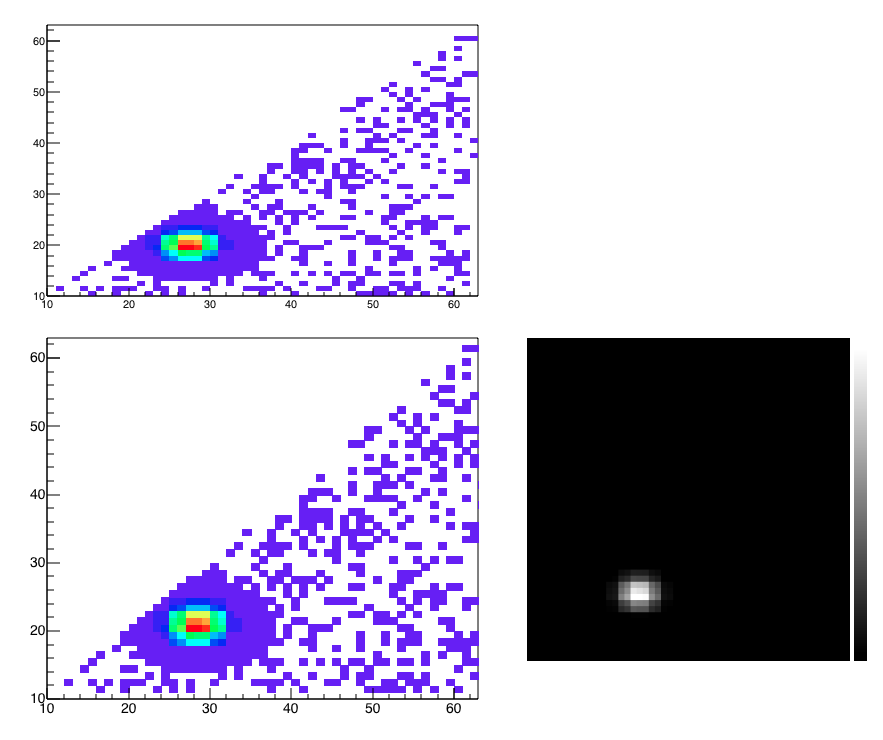
using the macro but I see in https://root.cern.ch/doc/master/classTImagePalette.html that there are only three predefined palettes.
You mean “bottom right” I guess… I will see if it is possible.
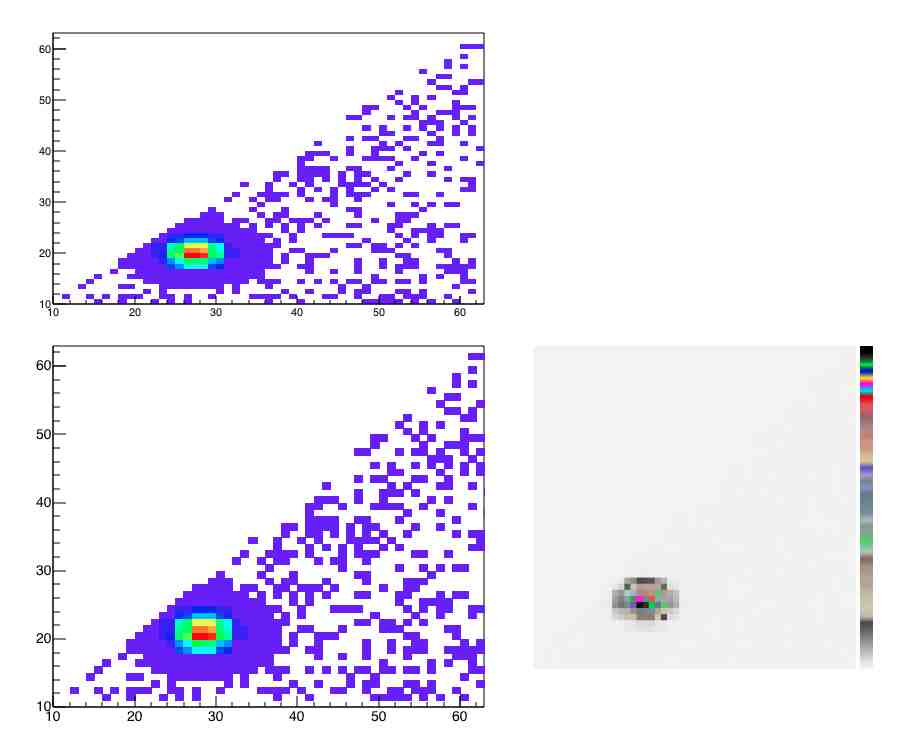
   Int_t MyPalette[100];
   Double_t Red[]    = {0., 1.0};
   Double_t Green[]  = {0., 1.0};
   Double_t Blue[]   = {0., 1.0};
   Double_t Length[] = {0., 1.0};
   Int_t FI = TColor::CreateGradientColorTable(2, Length, Red, Green, Blue, 100);
   for (int i=0;i<100;i++) MyPalette[i] = FI+i;
    auto pal = new TImagePalette (100,MyPalette);

   // Drawing
   center_pad->cd();
   gStyle->SetPalette(1);
   h2f->Draw("COL");

   top_pad->cd();
   gStyle->SetPalette(1);
   h2->Draw("COL");

   right_pad->cd();
   img->SetImage((const Double_t *)h2f->GetArray(), h2f->GetNbinsX() + 2,h2f->GetNbinsY() + 2, pal);
   img->Draw();
1 Like
Thank you so much. Works like a charm