Please read tips for efficient and successful posting and posting code
Please fill also the fields below. Note that root -b -q will tell you this info, and starting from 6.28/06 upwards, you can call .forum bug from the ROOT prompt to pre-populate a topic.
_ROOT Version:6.28
_Platform: Window 10
Compiler: Not Provided
Hi all, I’m a newbie.
I have a ROOT file generated from Geant4. I would like to read and plot Histograms in the file. They have same name EDep and a index from 1 to 6. I wrote a root script to read and plot Histograms. But it only show “h2”. Can anyone help me to fix it? Thank you in advance.
void analysis()
{
gROOT->Reset();
gROOT->SetStyle("Plain");
TFile* f = new TFile("out_QBBC.root", "READ");
// list all Tree and Historgram
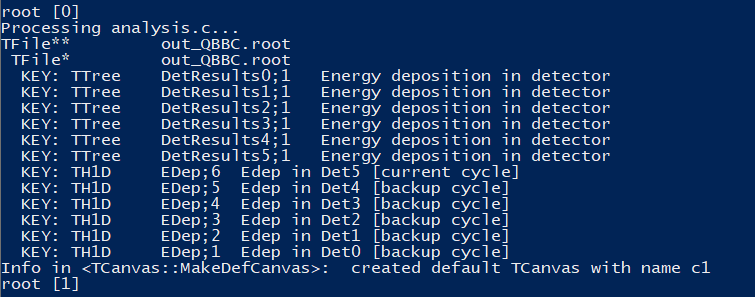
f->ls();
TCanvas* c1 = new TCanvas("c1", " ", 20, 20, 1000, 1000);
c1->Divide(1, 2);
// Draw pad 1
c1->cd(1);
gPad->SetLogy(1);
TH1D* h1 = f->Get<TH1D>("EDep;1");
h1->SetTitle("Detector 0 at 40 deg");
h1->GetXaxis()->CenterTitle(true);
h1->GetYaxis()->CenterTitle(true);
h1->GetXaxis()->SetTitle("MeV");
h1->GetYaxis()->SetTitle("Count");
h1->Draw("HIST");
// Draw pad 2
c1->cd(2);
gPad->SetLogy(1);
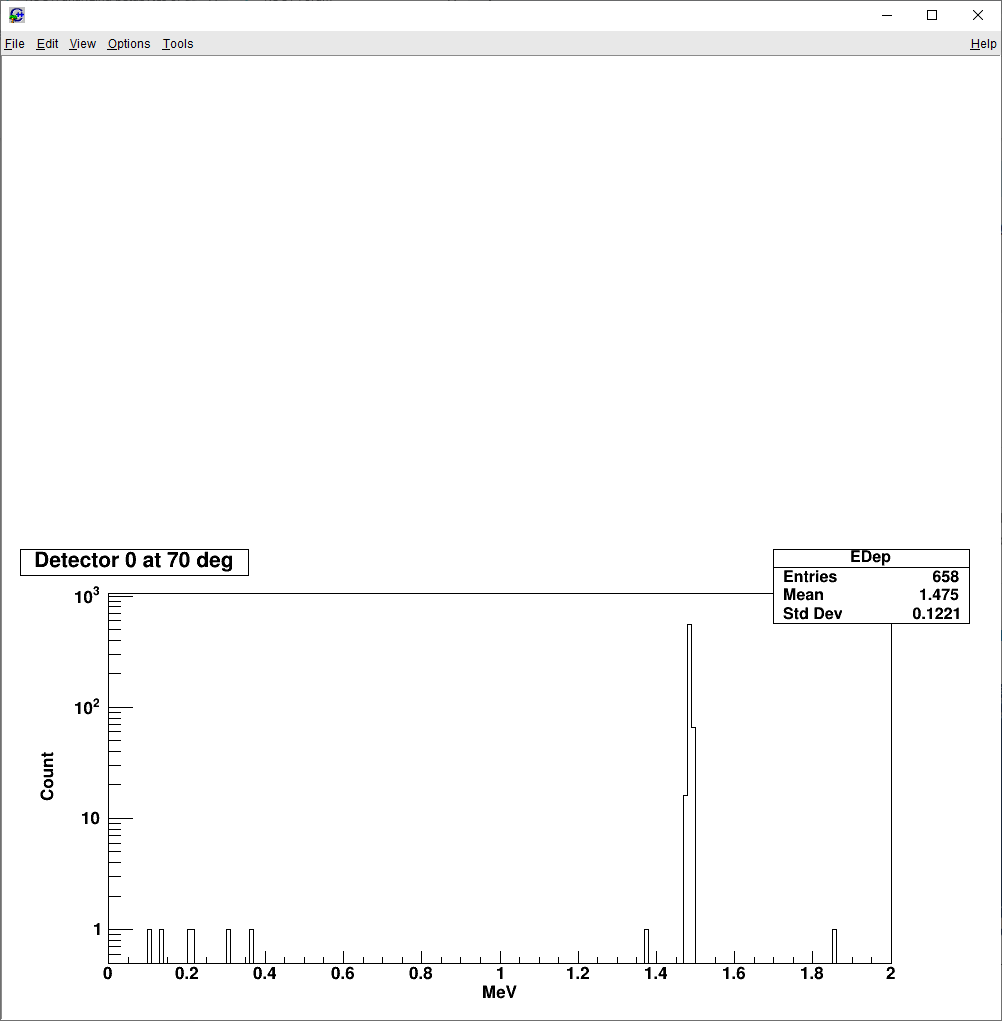
TH1D* h2 = f->Get<TH1D>("EDep;6");
h2->SetTitle("Detector 0 at 70 deg");
h2->GetXaxis()->CenterTitle(true);
h2->GetYaxis()->CenterTitle(true);
h2->GetXaxis()->SetTitle("MeV");
h2->GetYaxis()->SetTitle("Count");
h2->Draw("HIST");
}
Result:
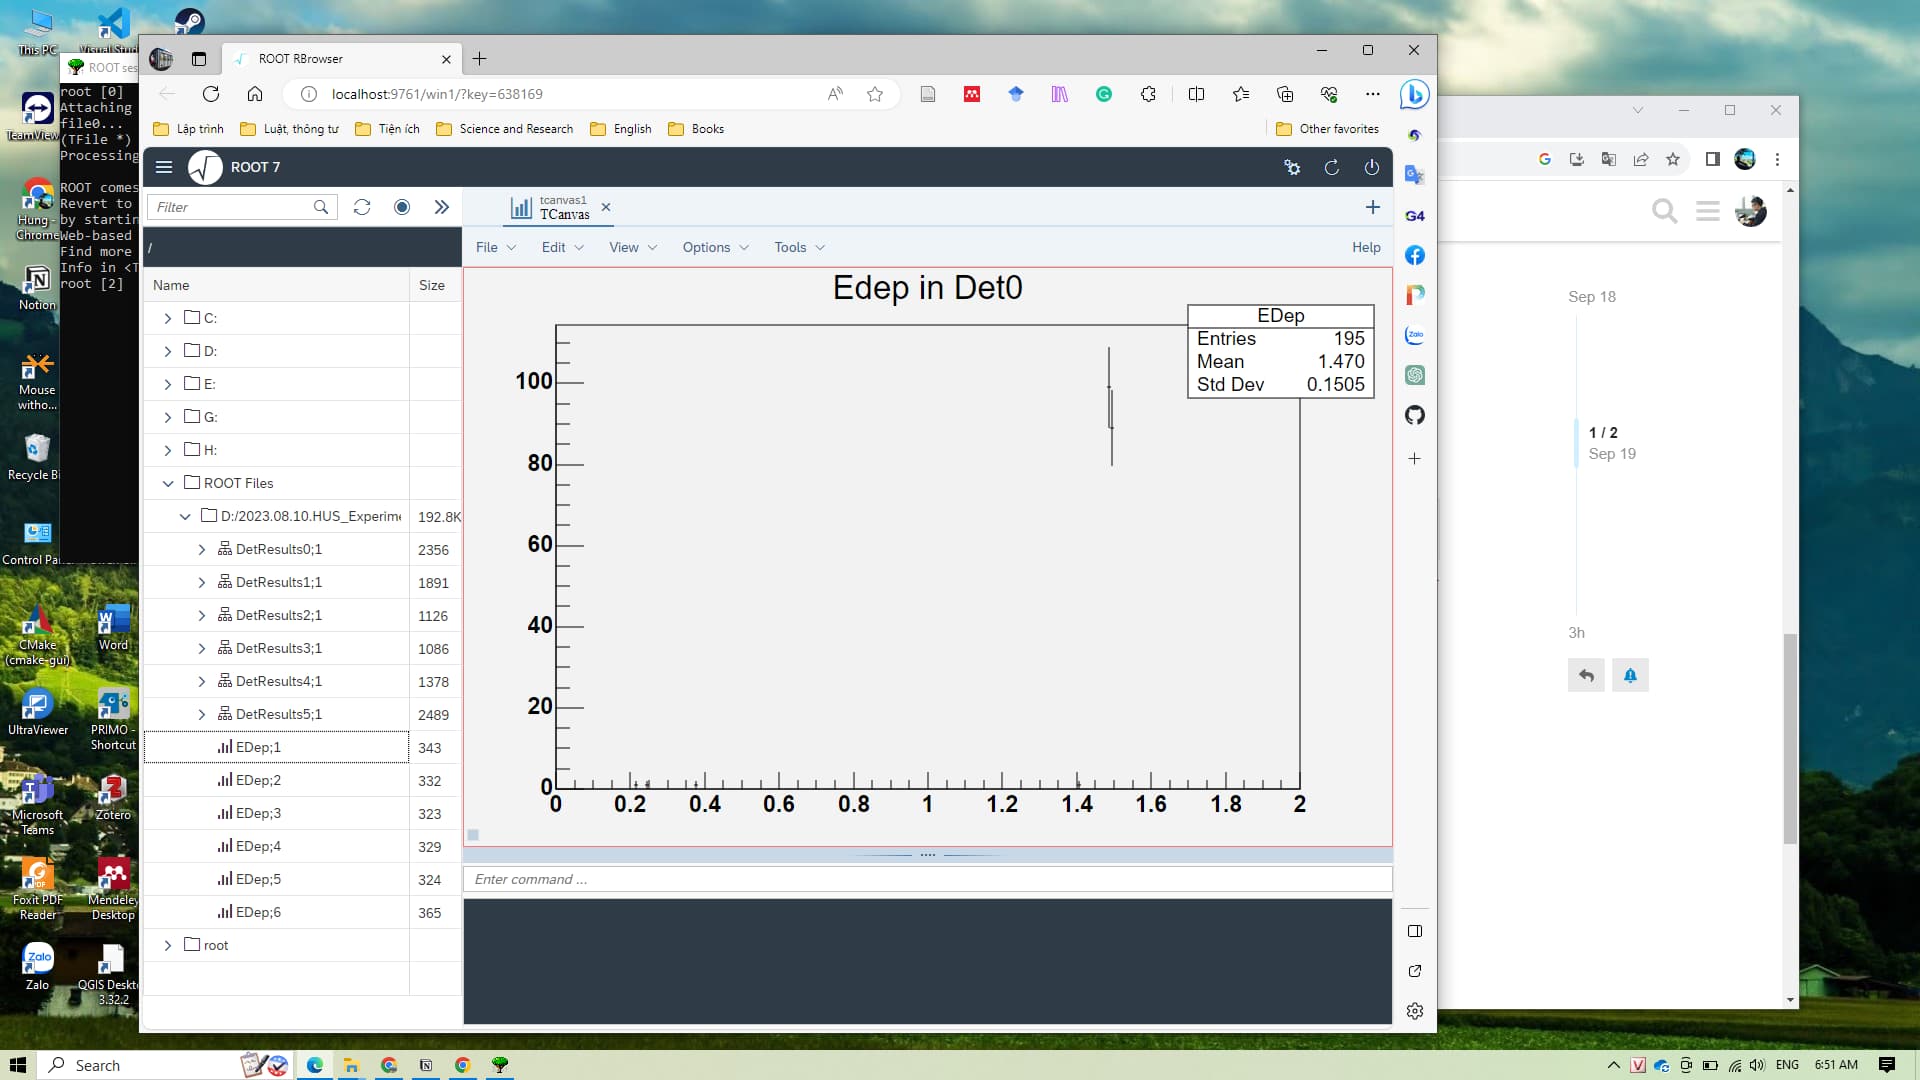
Your code looks ok to me. Is there anything wrong with the histogram “EDep;1”? For example, you can check it out in a TBrowser. If you are using interactive ROOT, type “TBrowser t”. You can also type “rootbrowse” from the regular command line. Open up the root file and try to look at the histogram? Does it look normal? Can you see it at all?
If you don’t like using the TBrowser, then write a short program or draw the histogram during an interactive root session (type “root -l” on the command line to start an interactive session) to take a look at it.
Dear @ackuhlma,
It’s nice to know your answear. I checked the ROOT file as you said. There is no error.
Normally your code would be fine. After some investigation, it seems that your problem is caused by the fact that both h1 and h2 are named “EDep”. ROOT is getting confused because (I believe) ROOT makes use of these names to distinguish histograms from each other. Adding the following line will make your code work correctly:
h1->SetName("something_else");
i.e.:
void analysis()
{
  gROOT->Reset();
	gROOT->SetStyle("Plain");

	TFile* f = new TFile("out_QBBC.root", "READ");
	// list all Tree and Historgram
	f->ls();

	TCanvas* c1 = new TCanvas("c1", " ", 20, 20, 1000, 1000);
	c1->Divide(1, 2);

	// Draw pad 1
	c1->cd(1);
	gPad->SetLogy(1);
	TH1D* h1 = f->Get<TH1D>("EDep;1");
    h1->SetName("something_else"); //add this line
	h1->SetTitle("Detector 0 at 40 deg");
	h1->GetXaxis()->CenterTitle(true);
	h1->GetYaxis()->CenterTitle(true);
	h1->GetXaxis()->SetTitle("MeV");
	h1->GetYaxis()->SetTitle("Count");
	h1->Draw("HIST");

	// Draw pad 2
	c1->cd(2);
	gPad->SetLogy(1);
	TH1D* h2 = f->Get<TH1D>("EDep;6");
	h2->SetTitle("Detector 0 at 70 deg");
	h2->GetXaxis()->CenterTitle(true);
	h2->GetYaxis()->CenterTitle(true);
	h2->GetXaxis()->SetTitle("MeV");
	h2->GetYaxis()->SetTitle("Count");
	h2->Draw("HIST");
}
Hope this helps!
Best,
Andrew