Thanks for letting me know, Here is the code in scipy:
[code]# import the needed modules
import numpy as np
import matplotlib.pyplot as plt
from pylab import *
from scipy.integrate import quad
define the integrand function
def F(p, x):
return 4445.935np.power(143.753 + 19 * np.log(p/x), -1, dtype=np.int16) * np.power(x, 0.2354424, dtype=np.int16) * np.power(1-np.power(x, 0.375, dtype=np.int16), 5.55373, dtype=np.int16)
def Zmomentlow1(p, x):
return 2np.power(x, 2)F(p, x)
def Zmomentlow2(p, x):
return 2np.power(x, 1.7)F(p, x)
def Zmomenthigh(p, x):
return 2np.power(x, 2)*F(p, x)
def Zmoment§:
for p, ep in enumerate§: #make Zmoment(enegrgy) values
if ep>0 and ep<=c:
Zmoment[p] = Zmomentlow1 + Zmomentlow2
elif ep>c:
Zmoment[p] = Zmomenthigh
set the parameters
c = 5.0E6 # the energy corresponding to the knee of the cosmic ray flux
a = 0 # lower limit of first integration of low-energy domain
b = 1 # upper limit of second integration of low-energy domain
N = 1000 # number of alpha values to use in integrations
def alpha§:
return p/c
p_ary = linspace(1.0E2,1.0E11,N) # create an array of values of energy
value = zeros(N) # create an array to store results of integrations
do the integrations low1, low2 and high
idx = 0
for p in p_ary:
value[idx],errorlow = quad(Zmomentlow1, a, alpha§, args = §) + quad(Zmomentlow2, alpha§, b, args = §)
value[idx],errorhigh = quad(Zmomenthigh, a, b, args = §)
idx = idx + 0.001
plot the result
plt.figure(1)
plt.clf()
plt.xscale(‘log’)
plt.plot(p_ary,value)
plt.ylim([0, 0.007])
note the new syntax for the xlabel() and title() commands
that allows the use of LaTeX commands
xlabel(‘energy [GeV]’)
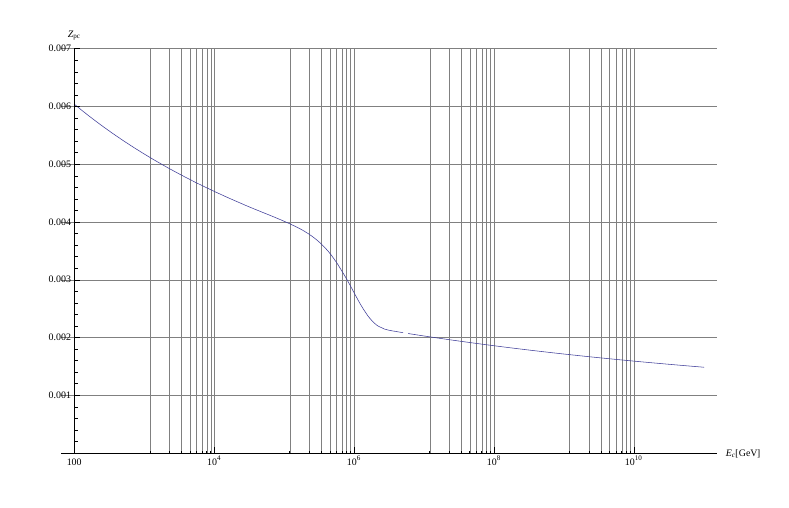
ylabel(‘Zmoment’)
title(‘Plot of Zmoment vs. Energy’)
plt.show()
plt.savefig(‘Figure1’)[/code]
Here is the error message I receive when running the code:
[quote]Traceback (most recent call last):
File “main4.py”, line 46, in
value[idx],errorlow = quad(Zmomentlow1, a, alpha§, args = §) + quad(Zmomentlow2, alpha§, b, args = §)
ValueError: too many values to unpack[/quote]