Dear ROOTers,
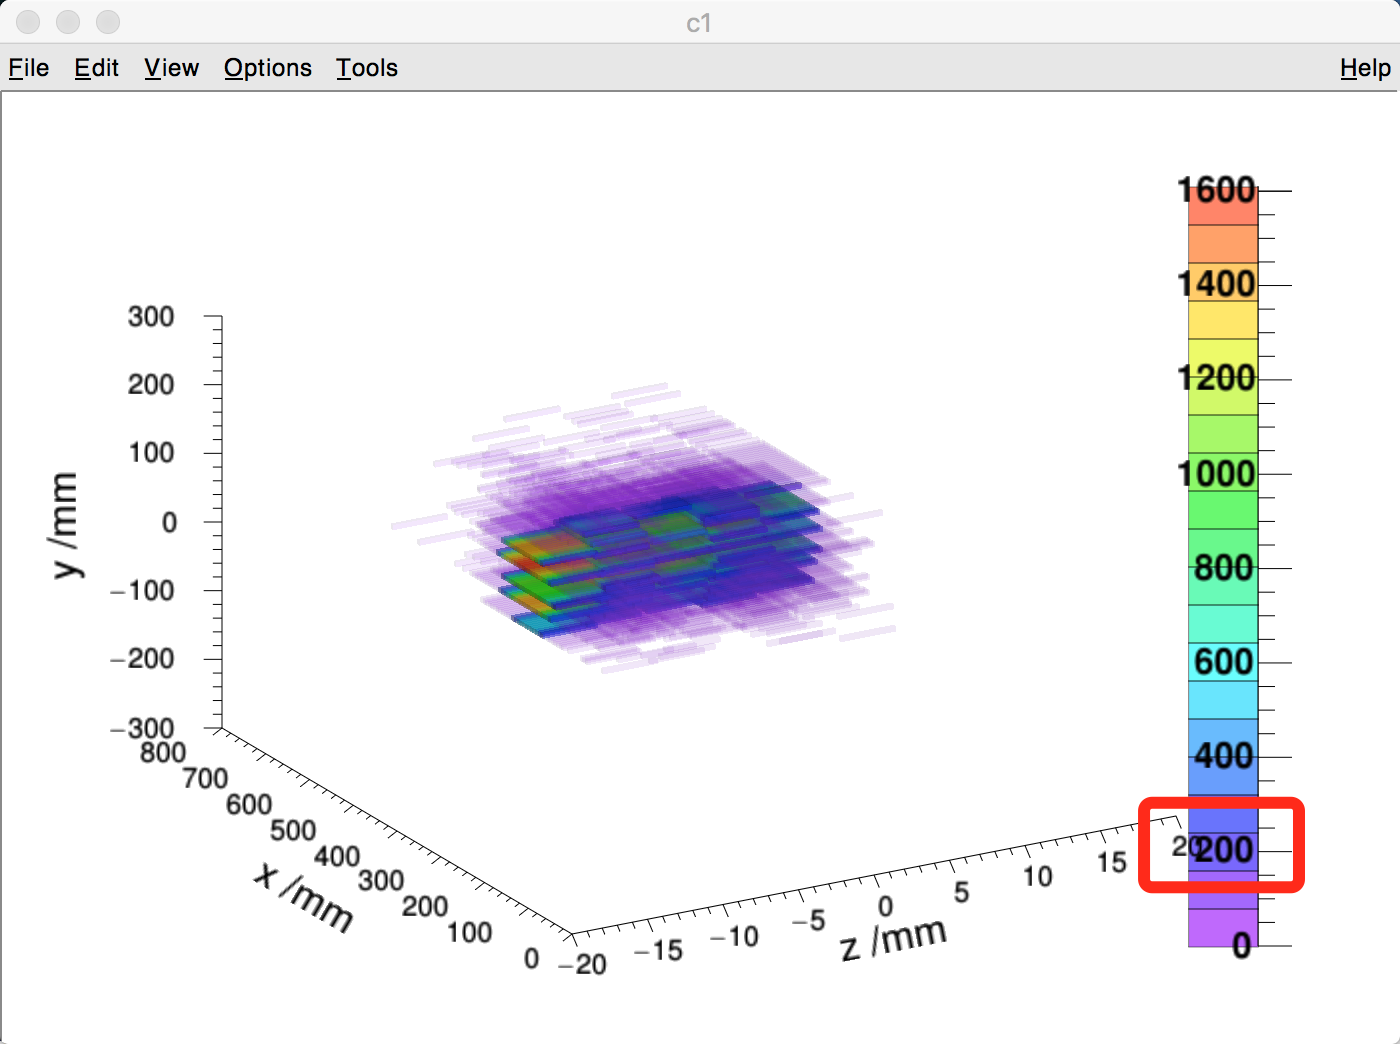
In the 3D histogram drawn by glvox2(/tutorials/gl/glvox2.C), a part of the label of X axis was covered by the palette.
But the palette can not be dragged by mouse. How can I move the palette or the histogram?
Thank you.
Dear ROOTers,
In the 3D histogram drawn by glvox2(/tutorials/gl/glvox2.C), a part of the label of X axis was covered by the palette.
But the palette can not be dragged by mouse. How can I move the palette or the histogram?
Thank you.
It’s painted in a fixed position and can not be moved (it’s not an interactive object).
hi, after
write:
[code]gPad->Update();
TPaletteAxis palette = (TPaletteAxis)hist->GetListOfFunctions()->FindObject(“palette”);
  // the following lines move the palette. Choose the values you need for the position.
  palette->SetX1NDC(0.84);
  palette->SetX2NDC(0.88);
  palette->SetY1NDC(0.2);
  palette->SetY2NDC(0.9);
  gPad->Modified();
  gPad->Update();[/code]
and set the numbers of
 palette->SetX1NDC(0.84);
      palette->SetX2NDC(0.88);
      palette->SetY1NDC(0.2);
      palette->SetY2NDC(0.9);
as it is better for your plot
I had your same problem with a TH2F plot and I resolved in this way…I think it works for a TH3F histogram too…
Thank you!
[quote=“faca87”]hi, after
write:
[code]gPad->Update();
TPaletteAxis palette = (TPaletteAxis)hist->GetListOfFunctions()->FindObject(“palette”);
  // the following lines move the palette. Choose the values you need for the position.
  palette->SetX1NDC(0.84);
  palette->SetX2NDC(0.88);
  palette->SetY1NDC(0.2);
  palette->SetY2NDC(0.9);
  gPad->Modified();
  gPad->Update();[/code]
and set the numbers of
 palette->SetX1NDC(0.84);
      palette->SetX2NDC(0.88);
      palette->SetY1NDC(0.2);
      palette->SetY2NDC(0.9);
as it is better for your plot
I had your same problem with a TH2F plot and I resolved in this way…I think it works for a TH3F histogram too…[/quote]
Thank you for the help!
It is a way to get the pointer of a palette. But it did not work in TH3D and openGL.
After I type the command “TPaletteAxis palette = (TPaletteAxis)hist->GetListOfFunctions()->FindObject(“palette”);”, “(TPaletteAxis *) nullptr” showed in the terminal.
It seems like the palette is fixed as the friend said in the second floor.
Hi, I’m sorry…as I wrote, I used that code and I resolved…but as I see you draw the graph in different way…