Hi,
I have tried using GetXaxis().SetTickLength() to increase the tick length but it’s not working. Is there any other way to increase the tick length in TGraph2D() ?
ROOT Version: 5.34/09
Platform: Scientific Linux
Hi,
I have tried using GetXaxis().SetTickLength() to increase the tick length but it’s not working. Is there any other way to increase the tick length in TGraph2D() ?
ROOT Version: 5.34/09
Platform: Scientific Linux
Try graph->GetHistogram()->GetXaxis()->SetTickLength(yourvalue) after drawing it.
It is not working, though it’s not showing any error.
Then it’s better if you show a minimal reproducer, something that we can run, or the code you are using, and what exactly you get.
c = TCanvas("Noise","Graph2d",0,0,700,600)
dt = TGraph2d()
x = np.linspace(0,1,40)
y = np.linspace(0,1,40)
k = 0
for i in range(40):
     for j in range(40):
          dt.SetPoint(k, x[i], y[j], Noise[i][j])
          k = k + 1
dt.SetTitle(" ; x ; y ; ")
dt.Draw("colz")
dt.GetHistogram().GetXaxis().SetTickLength(1.5)
dt.GetHistogram().GetXaxis().SetTickLength(1.5)
c.Write()
Here Noise is a 2D array of dimension 40x40
That code doesn’t run as-is, but at least add this
c.Modified()
c.Update()
after doing all the SetTickLength lines. It will probably work without Modified(), but keep it just to be safe.
Still not working.
Is this due to the version of the ROOT that I am working with ?
I don’t know. For me it works fine with th latest ROOT, and I cannot use ROOT 5 wth Python on Windows, so I cannot test.
But what exactly do you mean by “not working”? what do you get? what is the full code you are trying? Do you see anything if you don’t Write the canvas, just keep the canvas window open (add an “input” line instead of Write)?
By “not working”, I mean I am getting all the expected plots and labels, but I want to increase the tick length and using the command that you have suggested or that I was using earlier, I am not seeing any change in the tick length even though the expected plot gets created
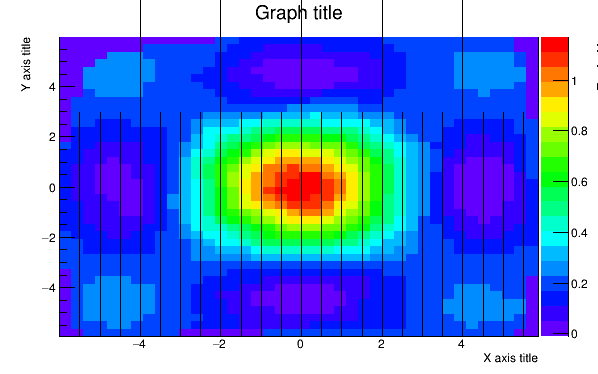
Try the first example in the TGRaph2D Documentation; instead of “surf1”, draw with “colz”, as you are trying to do; and add your SetTickLength line. For me it works (without even Updating the canvas) as expected with ROOT 5.34/38 on Windows; 1.5 is too big for the ticks, but you can see it works.
   TCanvas *c = new TCanvas("c","Graph2D example",0,0,600,400);
   Double_t x, y, z, P = 6.;
   Int_t np = 200;
   TGraph2D *dt = new TGraph2D();
   dt->SetTitle("Graph title; X axis title; Y axis title; Z axis title");
   TRandom *r = new TRandom();
   for (Int_t N=0; N<np; N++) {
      x = 2*P*(r->Rndm(N))-P;
      y = 2*P*(r->Rndm(N))-P;
      z = (sin(x)/x)*(sin(y)/y)+0.2;
      dt->SetPoint(N,x,y,z);
   }
   gStyle->SetPalette(1);
   dt->Draw("colz");
   dt->GetHistogram()->GetXaxis()->SetTickLength(1.5);
If that doesn’t work there may be other issues. Maybe try reinstalling, or another ROOT version.