Hi everyone!
I’m searching how to get the errors in a histogram when the entries have a associated error. I saw a lot of ways to do that when the entries have a weight (when they aren’t considered like unity). But, and when the entry for the horizontal axis in the histogram has a error. So, is needed to agree a error bar in the bins because the entry maybe is in some bin or in another bin… and this modifies the number of events in that bin…
Can somebody help me, please??
1 Like
Maybe you need to switch to some TGraph derived class … search for “Errors” in this Index of HIST/HIST.
Hello,
what about the TGraphErrors class? root.cern.ch/root/html/TGraphErrors.html
take a look and let me know
have fun
Gabriele
Yes… with the TGraphError I can plot the bin content like a point… but, the question is how to compute the errors? Seems a hard process… would be need to consider the possibility of a entry in a bin belongs to another bin… and this occur for all bins… leaving a uncertainty about the number of entries in each bins. I don’t see yet some functionality from TGraphError for to do that…
Hello,
Lets say that the entry of every bin is the count of values contained in that bin.
The TGraphError allows you to plot the bin content as a point PLUS the cross of error bars.
Since the entry is a Y value of the bin, the vertical error bar is just what seems you are talking about. Anyway seems to me that you have a little bit of confusion about what error means.
So, if the question is how to compute errors the answer is take a good statistic book (i.e. Glen Cowan one amazon.com/Statistical-Analy … 0198501552) and try to find the answer yourself, since root just implements standard error-calculation functions for fitting classes and any more complex error calculation must be built by your (as code writer) brain and knowledge.
Otherwise the TGraphError is the class you need to solve your problem, the only missing thing is a clear problem statement.
If you’re able to explain clearly what is the task you’re talking of (flowchart, words, image) I’ll be glad to try to help you.
have fun
Gabriele
ok… sorry if my words were not clear… let me try again: Suppose that I have entries for the invariant mass from a experiment. Each of these values have a error because of imprecision about something (the moment of particle, for instance) and this associates some uncertainty range to reconstructed mass (it means, the real mass value can be greater/lesser than value reconstructed). And so, in the reality I could have more/less entries in a bin by that reason. This results in “y” errors, even, coming from a “x” value! So, probably I must to consider that effect for the total error of the bin, not? And how to compute that?
Hello,
ok, now it’s clear the problem you have come into.
The first way that comes i my mind about how to translate the x-uncertainties in y-uncertainties is using a function that gives y=f(x). that function may be a fit of the data (with N=nbinsx parameters, that’s not a physics fit) or a local interpolation of the data (lets say a pol1 curve).
in this way, via the convolution of your p(x) (uncertainties distribution around data along x direction, for example a gaussian distribution with variance=x-uncertainties) with the f(x) you could get the errors you want.
I try to attach an image to explain my solution.
Anyway ROOT has some math tool that could be useful, for example the TGraph::Fit() method and the generic function class TF#.
I don’t know if there’s a straight forward method for getting this result in ROOT.
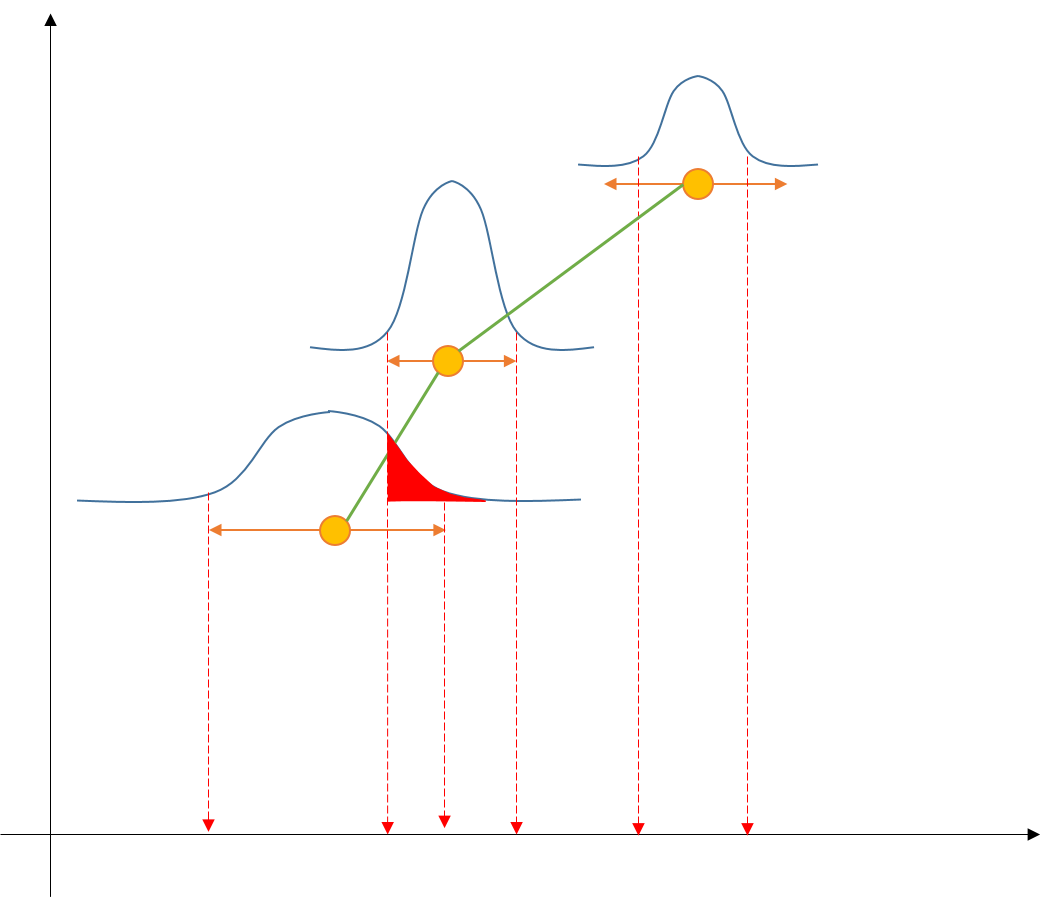
In the image:
- orange points + error bars = data
- green lines = interpolation with neighbors
- blue curves = data distribution inside error bar
- black arrows = axis
- red area = overlapping area
the idea is to consider the integral of the (data distribution)*(data interpolation) in order to achieve the maximum number of entries that could have been counted in a wrong bin due to x-uncertainties.
note that since the total number of entries can’t change, the negative value of the y-uncertainty of a bin is equal to the sum of all its contribution to POSITIVE y-uncertainty of the previous and next bins.
That’s my solution. For the convolution try this [root-forum.cern.ch/t/convolution-of-two-function/10925/1 .
have fun
Gabriele
Nice idea Gabriele! I will look more carefull for the procedure…
Thank you so much!
Hello!
I’m glad to read that my solution maybe could be useful.
Please report some feedback when you’re done.
Have fun
Gabriele
I want to ask what is the meaning of the axis in your diagram, especially the y-axis. I understand that the x-axis is the x. What is y-axis here? Is it the probability?
Thanks so much.
[quote=“Jet”]Hello,
ok, now it’s clear the problem you have come into.
The first way that comes i my mind about how to translate the x-uncertainties in y-uncertainties is using a function that gives y=f(x). that function may be a fit of the data (with N=nbinsx parameters, that’s not a physics fit) or a local interpolation of the data (lets say a pol1 curve).
in this way, via the convolution of your p(x) (uncertainties distribution around data along x direction, for example a gaussian distribution with variance=x-uncertainties) with the f(x) you could get the errors you want.
I try to attach an image to explain my solution.
Anyway ROOT has some math tool that could be useful, for example the TGraph::Fit() method and the generic function class TF#.
I don’t know if there’s a straight forward method for getting this result in ROOT.
In the image:
- orange points + error bars = data
- green lines = interpolation with neighbors
- blue curves = data distribution inside error bar
- black arrows = axis
- red area = overlapping area
the idea is to consider the integral of the (data distribution)*(data interpolation) in order to achieve the maximum number of entries that could have been counted in a wrong bin due to x-uncertainties.
note that since the total number of entries can’t change, the negative value of the y-uncertainty of a bin is equal to the sum of all its contribution to POSITIVE y-uncertainty of the previous and next bins.
That’s my solution. For the convolution try this Convolution of two function .
have fun
Gabriele[/quote]
Dear caobing,
I think that the best policy for this kind of questions is a private message, since the topic is rather old!
The y-axis of the graph is the y-axis of your data, while each gaussian peak as to be intended as plotted on a small cartesian surface in which the y-axis is the probability.
What I wanted to point out with the quoted example is that whatever x-y data set you have, the y-axis uncertainty, due to the x-axis uncertainty on data AND the presence of some kind of binning, on each point is the integral of the distribution of x values in a x range equal to the zone in which that distribution crosses the border between two bins. The blue curves are exactly the distribution of x values in each bin of the binned dataset.
I hope it helps
have fun