Hello. I just started working with Root, and I’m writing a script to take a histogram and fit it to a landau function using Pyroot. To my knowledge, the first parameter of the landau function is the location of its peak, so I set it to be the location of the peak of my plot. However, the landau function is shifted rightward, and its peak is not placed at the value which I set it to.
Here’s the relevant portion of my code:
for E, file in files.iteritems():

   hists[E].Rebin(50)

   xAxis = hists[E].GetXaxis()
   nBins = xAxis.GetNbins()

   peakN = hists[E].GetMaximumBin()
   peakX = hists[E].GetXaxis().GetBinCenter(peakN)
   peak = hists[E].GetBinContent(peakN)

   print('final peak:', peak)
   print('final peak X:', peakX)
   fit = r.TF1("landau","landau(0)")                         # Define the fit object to be landau
   fit.SetParameter(0,peakX)             # Initialize the fit object to the mean of the histogram...

   hists[E].Draw("Same PLC PMC")                              # Draw the histogram, the "Same" argument keeps previous content on the Canvas


   hists[E].Fit(fit, "B")                                  # Fit the curve
   fit.Draw("Same")                                      # Draw the fit onto the histogram

## SAVE THE HISTOGRAM

canvas.SaveAs("output.pdf");
I get an output of peakX = 252.5. This is the resulting plot and fitted function.
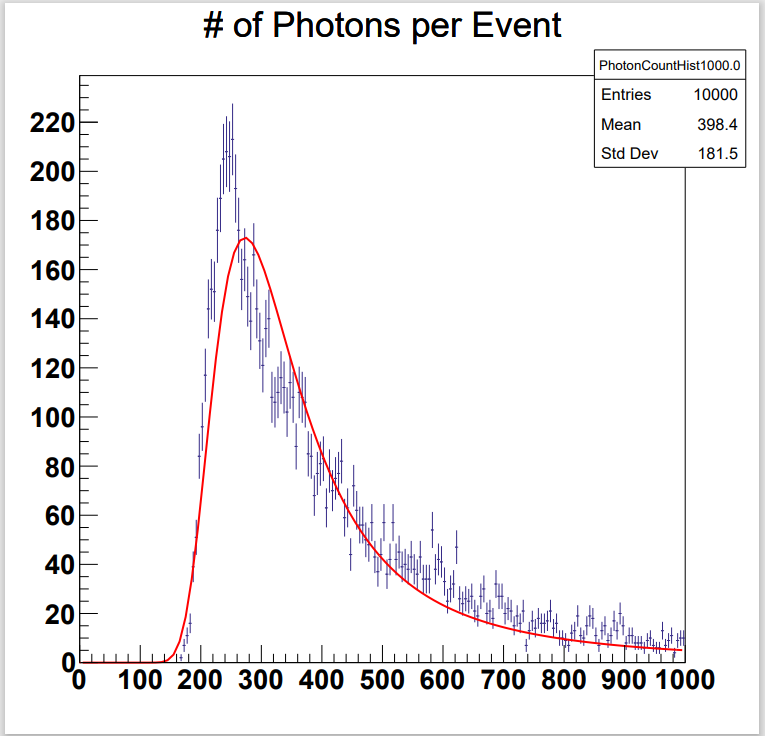
I would prefer that the landau function be fit so that its peak matches up with the peak of my histogram plot. How would I achieve this? Thanks a lot in advance.
I’m using Root 6.26.04 and Python 3.10.5