Hello ROOTers,
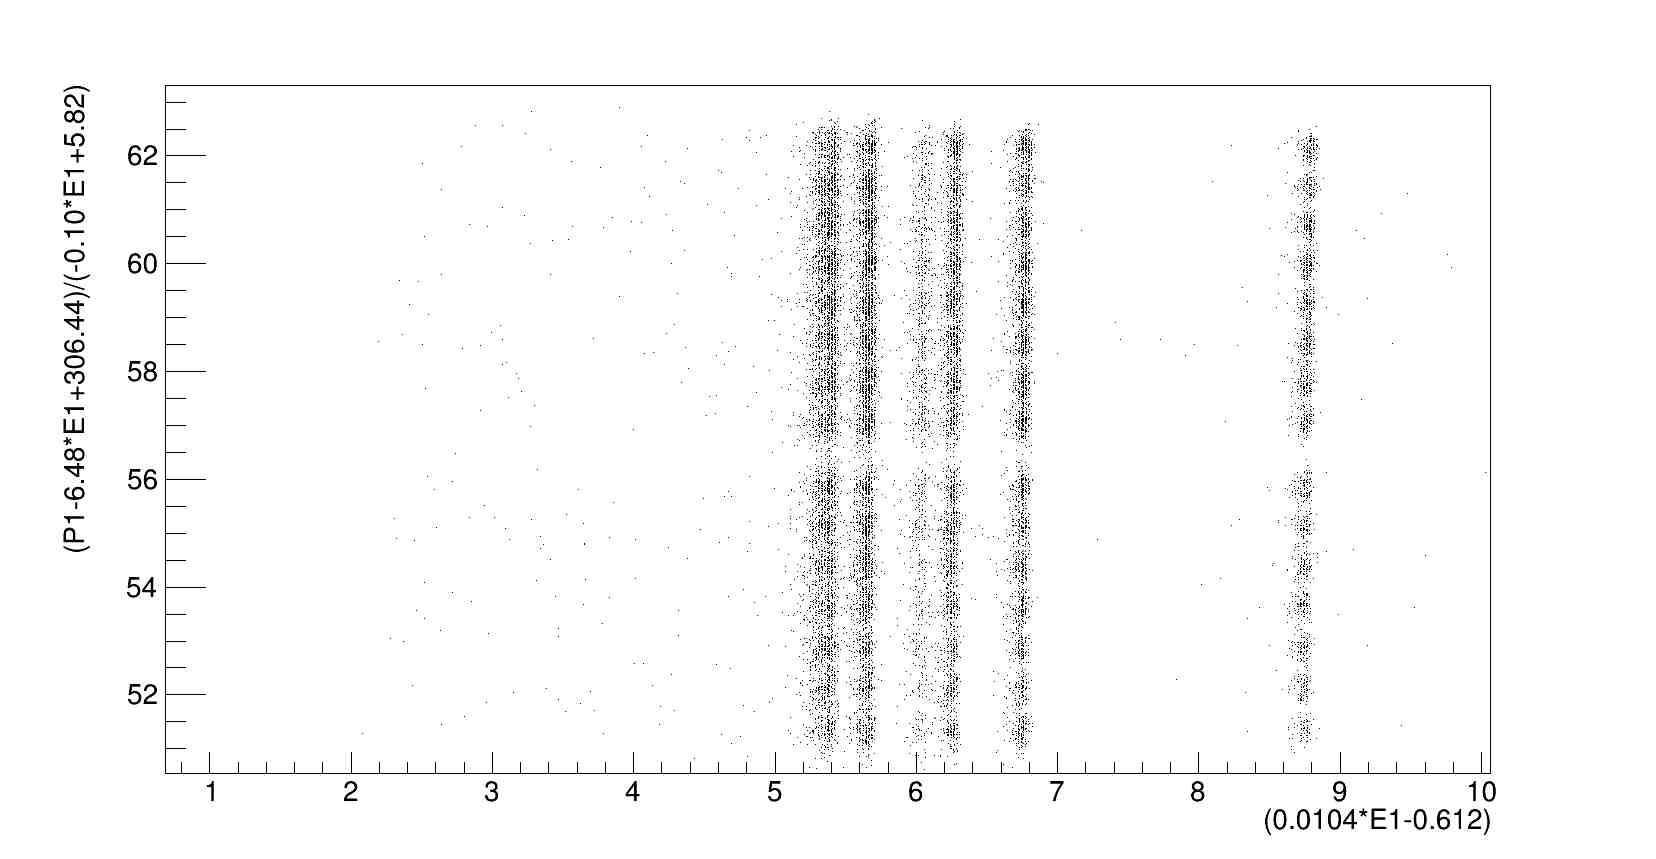
I’m trying to graph a data set created by plotting two leaves P1 and E1
with the colz option, the result is very bad:
To improve this graph, I can take this data and create a TH2F object and set the bins. How can I do that? The data are in a root file.
Thanks in advance .
Try:
gROOT->cd(); // just a precaution
delete gROOT->FindObject("h"); // prevent "memory leak"
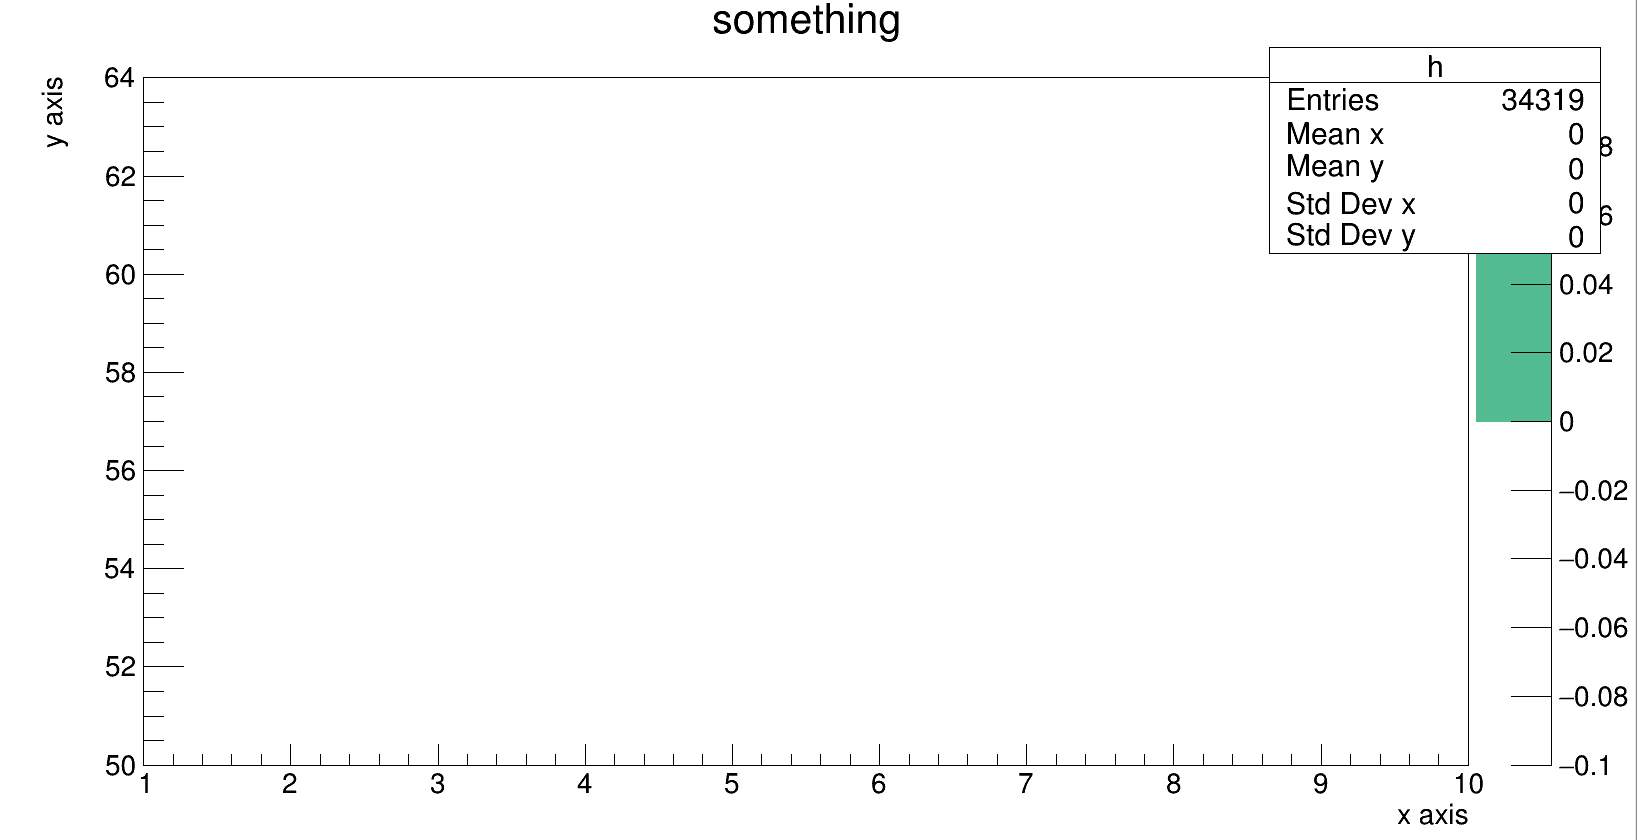
TH2F *h = new TH2F("h", "something;x axis;y axis", 180, 1., 10., 56, 50., 64.);
tree->Draw("(y something) : (x something) >> h", "", "colz");
I don’t see any data but the note count 34319 entries…
But you did replace “(y something) : (x something)” with your proper formulas?
Of course:
root [7] gROOT->cd()
(bool) true
root [8] TH2F *h = new TH2F("h", " th2f;x axis;y axis", 180, 1., 10., 180, 50., 64.);
Warning in <TROOT::Append>: Replacing existing TH1: h (Potential memory leak).
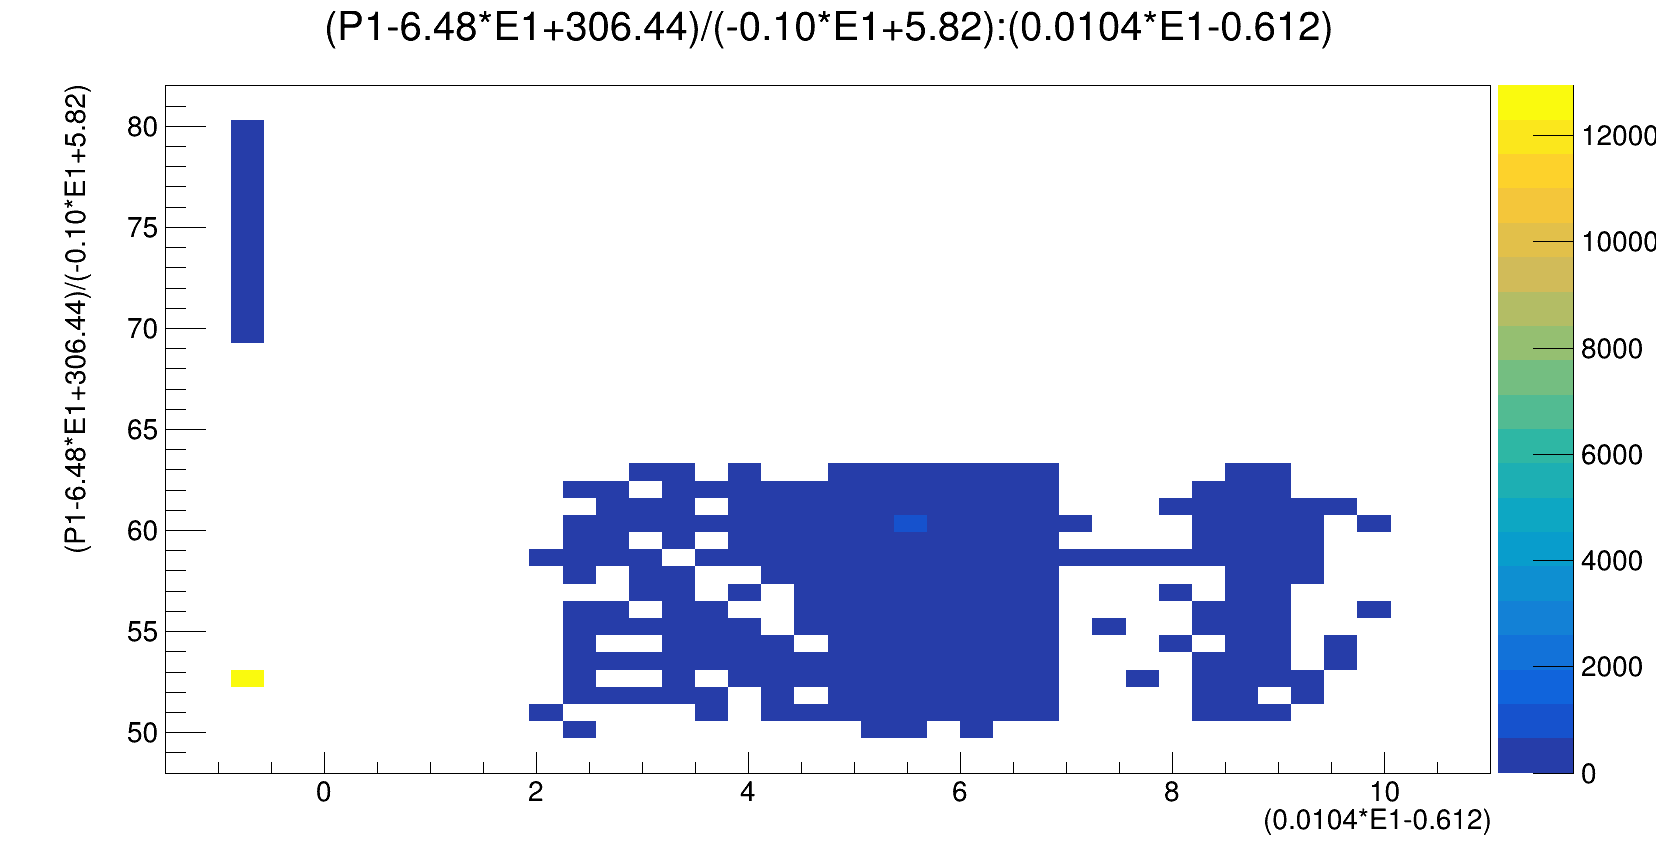
root [9] tv__tree->Draw("P1:E1>>h","","colz");
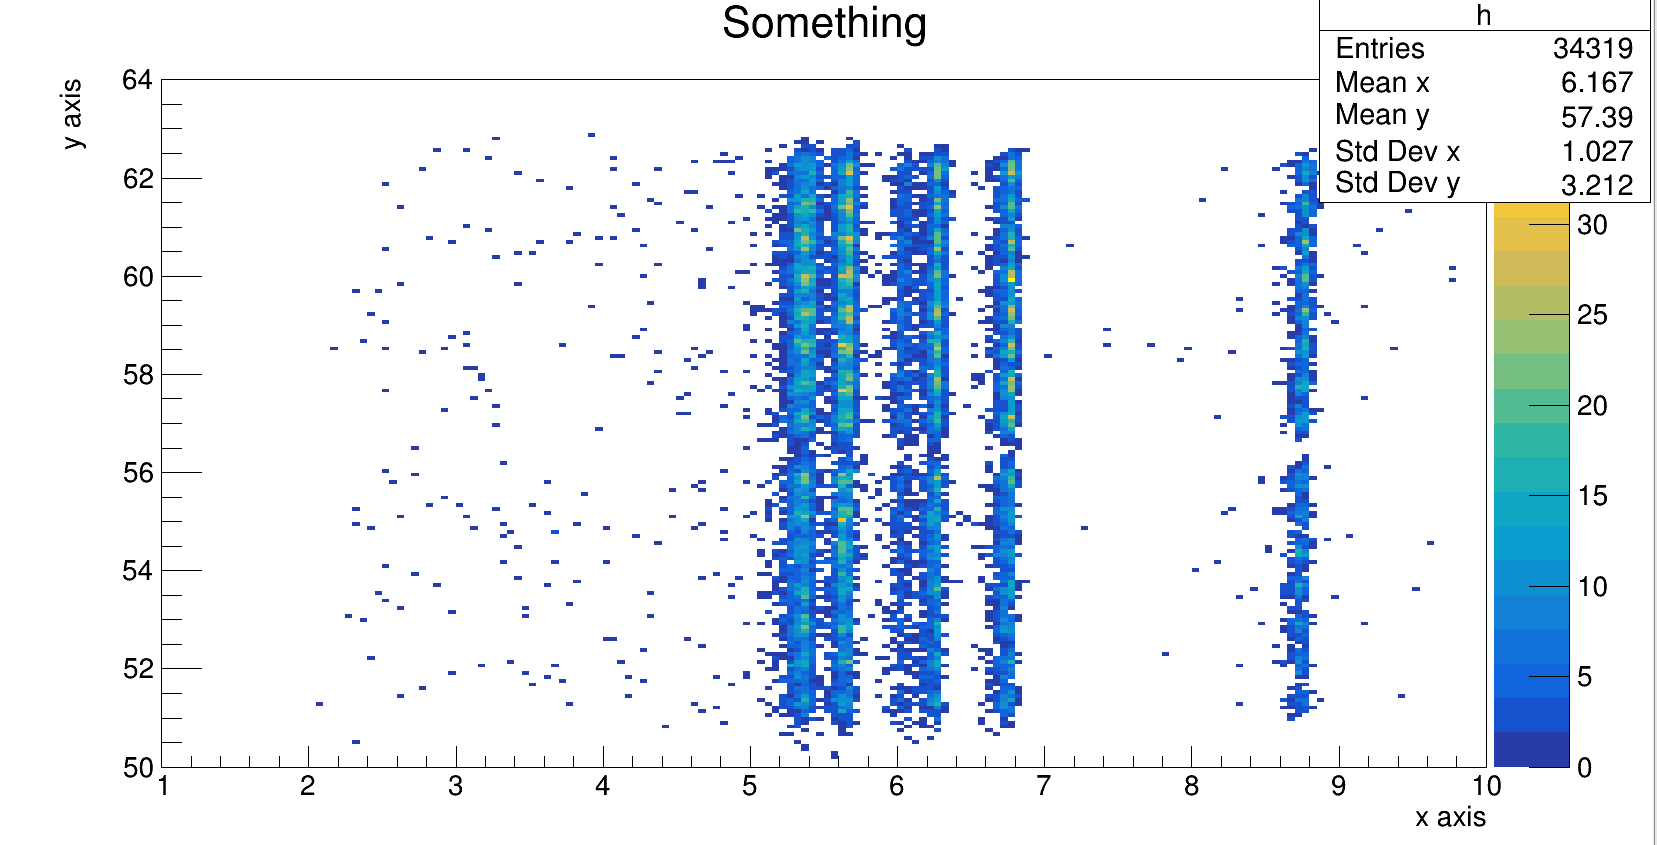
Use exactly the same formulas as for the first plot (otherwise histogram’s axes’ ranges are wrong).
Also, use:
delete gROOT->FindObject("h"); // prevent "memory leak"
You are right.
In order to improve it, i need to change “180” in an higher value?
system
Closed
8
This topic was automatically closed 14 days after the last reply. New replies are no longer allowed.