I am in the home stretch of my thesis and am trying to construct a multigraph.
I need my data, from a .root file, overlayed with the data from a .csv file that I generated to replicate someone’s previous work. I have gotten the following to graph two different .csv files,
// Manage several graphs as a single entity.
void multigraph(){
TCanvas *c1 = new TCanvas(“c1”,“multigraph”,700,500);
c1->SetGrid();
auto mg = new TMultiGraph();
// create first graph
auto gr1 = new TGraph(“Carrier_Be_5MeV_recreation.csv”);
gr1->SetMarkerColor(kBlue);
gr1->SetMarkerStyle(20);
mg->Add(gr1);
// create second graph
auto gr2 = new TGraph(“Carrier_Be_1MeV_recreation.csv”);
gr2->SetMarkerColor(kRed);
gr2->SetMarkerStyle(20);
mg->Add(gr2);
mg->Draw(“apl”);
gPad->Update();
gPad->Modified();
}
But, the data from my runs are in a .root file, and I can only get the above code to work with two .csv files, and not a combo of .root and .csv.
This leaves me with one of two options:
1.) Figure out how to get the above code to graph my .root and corresponding .csv files.
2.) Figure out how to get XY-Values from my .root file so that I can generate a .csv file and use the above code.
If number #1 isn’t possible, which it hasn’t yet been for me, then I need #2 and I really don’t wanna painstakingly take all 100 point values by hand, for 20+ graphs. It seems to me that there should be some way to extract the XY-values from my .root file, but I can’t figure this out.
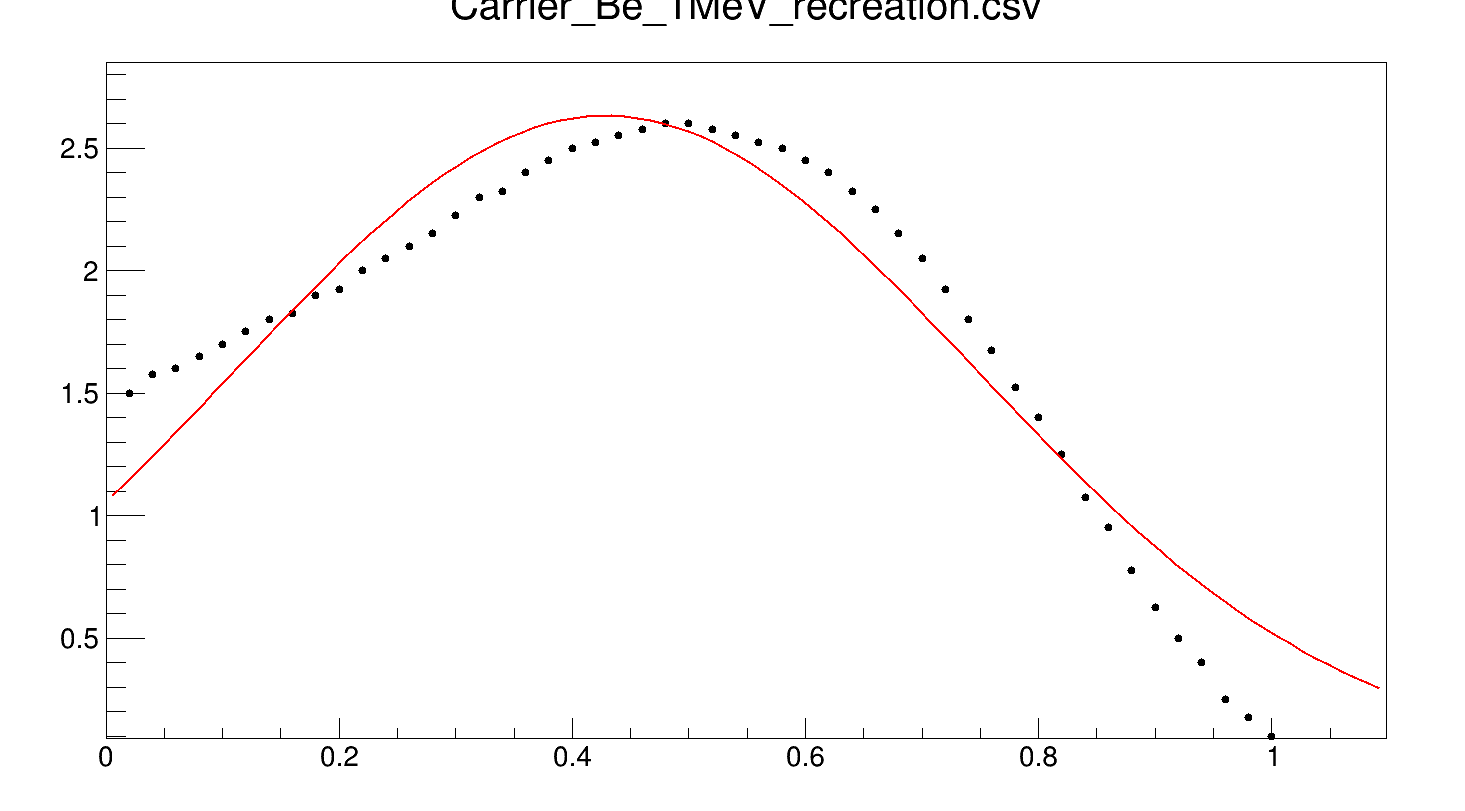
I am also having issues getting a clean Gaussian fit on my .csv file. I am having to resort to using a high order polynomial to get a close fit. It seems to me that there should be a way to use the gaussian fit as my data is a gaussian curve. I use the g->Fit("pol6) instead of g->Fit(“gaus”). See the picture attached for an understanding of what is going on with the gaussian fit. I can make do with the poly6 for this data if I end the graph at 1 to eliminate the rest of the fit line, but I don’t know if this workaround will continue to work for other data files, and I would like to know how to do it properly. It seems to me that this should be a simple graph to get a good clean fit for.
You could read the XY values in your .root file and put them into two arrays, and feed those arrays as arguments to a TGraph. You can use graph->Draw(“same”) to overlay it with the other two you have.
For your second question, I am assuming the black points are your data points. They don’t look Gaussian which probably why a pure Gaussian fit doesn’t work. Maybe a composite function could work better i.e. a Gaussian with a linear function.
I didnt start using ROOT till a few days ago. I dont know how to read the XY values form the .root or anything in rest of solution. Could you provide the comand/code to do so or pooint me to the sources where I may figure out how to follow your solution?
I don’t know if it dose have a TTree,
when I do root -l file.root
i get
Attaching file FCGa.root as _file0…
(TFile ) 0x26554b0
root [1] .ls
TFile* FCGa.root
TFile* FCGa.root
KEY: TH1D 8;1 Edep (MeV.cm2/g) along x/r0
I dont see TTre listed here as I do in other examples.
Also, I have looked at the link you provided for the reading of the root. The solution is not jumping out at me but I can continue to look at it. I am really new to this so the extent of my knowledge is using the rootbrose and having cut and pasted the orginal file together to get two graphs .
where I would need to modify it for my situation where I already have the .root and don’t need to generate it. Most of my attempts to do anything with this file seems to fail because it’s named 8, which is an int.
I had assumed there would be a terminal command or way in the browser to get the points. It the only way do do this to write it into the C macro?
Oh. Your .root file contains a TH1D object, which is a 1D histogram.So I think you can directly plot it. You can do something like this:
TFile *f1 = new TFile("yourfile.root","open"); //loads in the .root file
TH1D * h1 = (TH1D *)f1->Get("8"); //gets the TH1D object from the .root file
h1->Draw("same"); // draw on the same canvas as the rest.
Thank you, I belive this will lead to it working, however I am geting a error:
// Manage several graphs as a single entity.
void multigraph(){
TCanvas *c1 = new TCanvas(“c1”,“multigraph”,700,500);
c1->SetGrid();
auto mg = new TMultiGraph();
// create first graph
auto gr1 = new TGraph(“Carrier_Be_5MeV_recreation.csv”);
gr1->SetMarkerColor(kBlue);
gr1->SetMarkerStyle(20);
mg->Add(gr1);
// create second graph
auto gr2 = new TGraph(“Carrier_Be_1MeV_recreation.csv”);
gr2->SetMarkerColor(kRed);
gr2->SetMarkerStyle(20);
mg->Add(gr2);
mg->Draw(“apl”);
TFile *f1 = new TFile(“DDT5root”,“open”); //loads in the .root file
TH1D * h1 = (TH1D *)f1->Get(“8”); //gets the TH1D object from the .root file
h1->Draw(“same”); // draw on the same canvas as the rest.
gPad->Update();
gPad->Modified();
}
In file included from input_line_9:1:
/home/Badger/Documents/multigraph.C:25:4: warning: null passed to a callee that requires a non-null argument [-Wnonnull]
h1->Draw(“same”); // draw on the same canvas as the rest.
I don’t know hwy this is but will continue to play with it and see if I can figure it out.
This allowed it to graph
I do have a scaling issue but that is managable.
Thank you so much
the final code fopr reference
// Manage several graphs as a single entity.
void multigraph(){
TCanvas *c1 = new TCanvas(“c1”,“multigraph”,700,500);
c1->SetGrid();
auto mg = new TMultiGraph();
// create first graph
auto gr1 = new TGraph(“Carrier_Be_5MeV_recreation.csv”);
gr1->SetMarkerColor(kBlue);
gr1->SetMarkerStyle(20);
mg->Add(gr1);
// create second graph
auto gr2 = new TGraph(“Carrier_Be_1MeV_recreation.csv”);
gr2->SetMarkerColor(kRed);
gr2->SetMarkerStyle(20);
mg->Add(gr2);
mg->Draw(“apl”);
TFile *f1 = new TFile(“DDT5.root”,“open”); //loads in the .root file
TH1D * h1 = (TH1D *)f1->Get(“8”); //gets the TH1D object from the .root file
h1->Draw(“same”); // draw on the same canvas as the rest.
gPad->Update();
gPad->Modified();
}
p.s chii is the best cat , love your icon picture. And thanks again for your help.