addi
August 28, 2017, 4:39am
1
Hi all,
I am new in root, sorry in advance if my questions seems basic to you. I want to get a 1D histogram from a .root file and draw it in a colz text e. But the problem is i donot know how to make these boxes of any rang. Like in x-axis i want a box range of {0,10,30,60,100,200} where in y-axis {0,1,1.6,2,2.4,3}.
Thank you.
Danilo
August 28, 2017, 5:32am
2
Hi Adi,
what is a “box range of {0,10,30,60,100,200} where in y-axis {0,1,1.6,2,2.4,3}” ? In 2D, to draw a rectangle, I would expect 4 x,y coordinates.
cheers,
addi
August 28, 2017, 5:37am
3
Hi dpiparo,
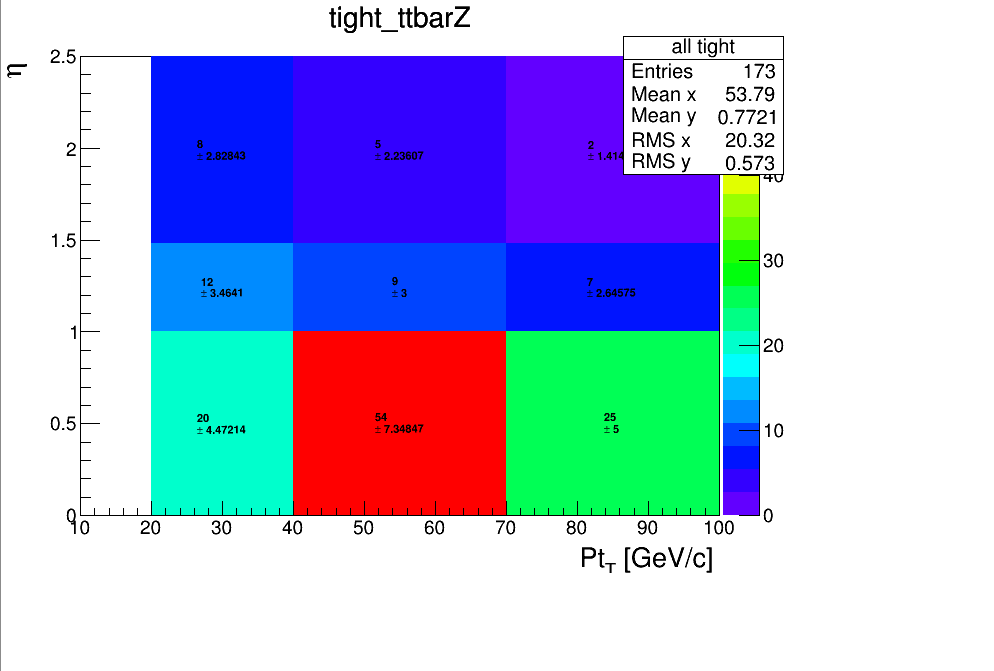
I want to plot a 2D histogram in colz text e. Where these values are x axis limits and y axis limits. Sample plot is attached below
addi
August 28, 2017, 5:38am
4
The boxes means 20-40 in x axis and 0-1 in y axis.
Danilo
August 28, 2017, 5:38am
5
addi
August 28, 2017, 5:42am
6
Hi D,
Constructor only changes the x-axis in one bin i mean let 0-20. similarly in y. I want to change x in 5 different bin sizes.
Danilo
August 28, 2017, 5:43am
7
Hi,
I do not understand the statement. You can pass the bin edges you need to the constructor, can’t you?
Cheers,
addi
August 28, 2017, 5:49am
8
Hi D,
I am sending you these few lines. Hope so it will make easy for you understand it.
   TFile *f1 = new TFile("merge.root");
TH2F *h2 = (TH2F*)gDirectory->Get("pt_eta");
   double bins_x[] = {10, 20, 40, 70, 100,200};
  double bins_y[] = {0, 1, 1.5, 2.5,3};
TH2F *h2 = new TH2F("h2", "pteta",(sizeof(bins_x) / sizeof(double) - 1), bins_x, (sizeof(bins_y) / sizeof(double) - 1), bins_y);
h2->Draw(colz text e);
What i am doing is this. It will draw the the plot like posted above. But it is not drawing like the above mensioned plot. How would I achieve this.
Danilo
August 28, 2017, 7:03am
9
Hi,
I am not sure I get it. h2 seems to be empty.
Cheers,
addi
August 28, 2017, 7:10am
10
Then how would I can do it? Can someone else help me to do it. I need to it urgently.
Danilo
August 28, 2017, 7:20am
11
Hi,
you created an empty histogram, you need to fill it with the content you would like to display.
Cheers,
addi
August 28, 2017, 7:22am
12
Hi D,
Of course i will fill the histogram with some data. All I want to know is how I can write the command to make such a histogram.
Danilo
August 28, 2017, 7:27am
13
Hi,
the command you have is correct. The issue is that presently your histogram is empty.
Cheers,