Hi,
I want to draw multiple TGraphs on the same canvas, but with different x-axis ranges. For example, I want to make plots like this where different TGraphs have different ranges of drawing (dashed line of this plot):
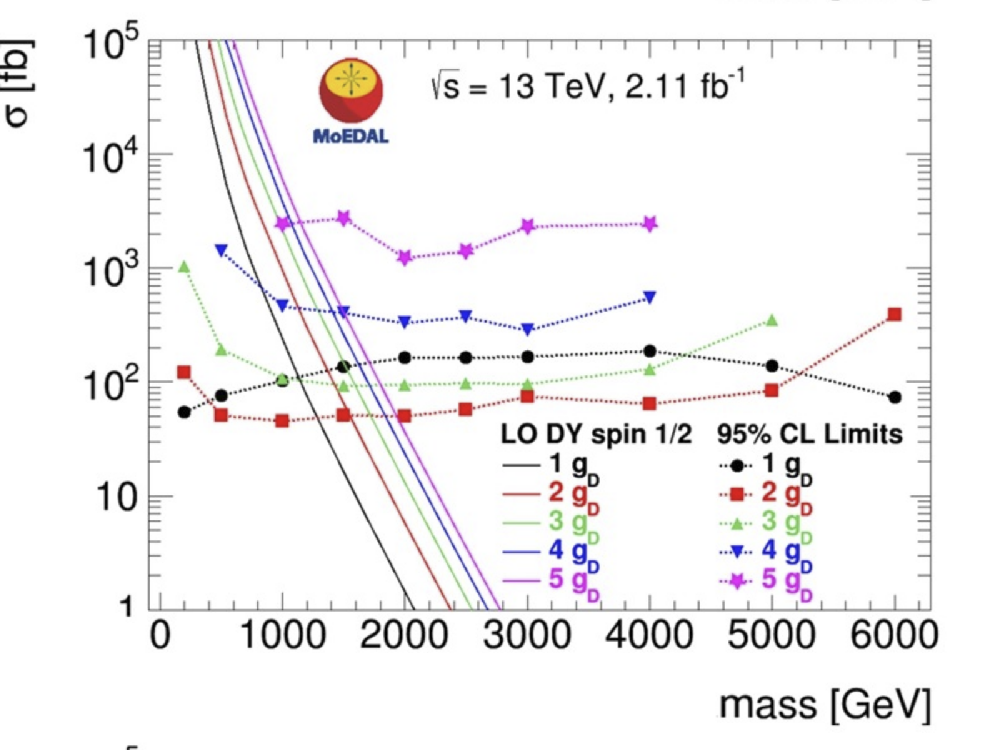
What is the best way to do this kind of plots? I wanted to use TMultiGraph, but can I chose separate x-axis range for separate TGraphs? If not, how should I do this kind of plots?
Thank you,
Arka
_ROOT Version:6.14/06
_Platform:Ubuntu 18.04
_Compiler: gcc 7.3.0