Hii experts,
I have a dat file and want to fill a histogram. Ensure that each bin contains at least 5 counts.
Then after it will fit two Gaussian distributions. How to count at least 5 in each bin? kindly help me.
Here i have attached the macro:
TFile *f1 = new TFile(“count.root”, “RECREATE”);
TTree *tr = new TTree(“ntuple”, “data”);
tr->ReadFile(“hist_plot.dat”, “x”);
TH1F *h1 = new TH1F(“h1”, “Gaussian Distribution”, 20, -2.4, 2.9);
h1->GetXaxis()->SetTitle(“log_{10}(Value)”);
h1->GetYaxis()->SetTitle(“Counts (Frequency)”);
tr->Project(“h1”, “log10(x)”);
f1->Write();
TCanvas *c1 = new TCanvas();
c1->cd(1);
h1->Draw(“hist”);
Thanks,
Anil
Hi,
I would do something like this
bool check_bins=kTrue;
int i=1;
do{

if(h1->GetBinContent(i)<5)
check_bins=kFalse;
i++;
}while(check_bins  && i<=h1->GetNbinsX())
if checks_bin is true after the do-while loop all your bins have more than 5 counts
Stefano
Thank you @Dilicus. The first two bins contain less than 5 counts however others are fine. Should we add these two bin counts so that it might be at least 5?
It is wrong to modify the data.
What you can do is to exclude the first bins from the fit or better you can do a fit using the sum of a gaussian for the signal and a pol(0) or pol(1) for the background
Ok will try. Thank you @Dilicus
I want to fit double Gaussian into a histogram. Here is the macro:
TFile *f = new TFile("assign1.root");
TH1F *h1 = (TH1F*)f->Get("h1");
TF1 *g1 = new TF1("fit1", "gaus", -2.4,1.);
g1->SetLineColor(kRed);
TF1 *g2 = new TF1("fit2", "gaus", 0., 2.9);
g2->SetLineColor(kGreen);
TF1 *f1 = new TF1("double_gaus", "gaus(0) + gaus(2)", -2.4, 2.9);
f1->SetParNames("Constant 1", "Mean 1", "Sigma 1", "Constant 2", "Mean 2", "Sigma 2");
f1->SetLineColor(kBlue);
gStyle->SetOptFit(1);
h1->Fit(g1, "R");
h1->Fit(g2, "R+");
Double_t par[6];
g1->GetParameters(&par[0]);
g2->GetParameters(&par[2]);
f1->SetParameters(par);
h1->Fit(f1, "R+");
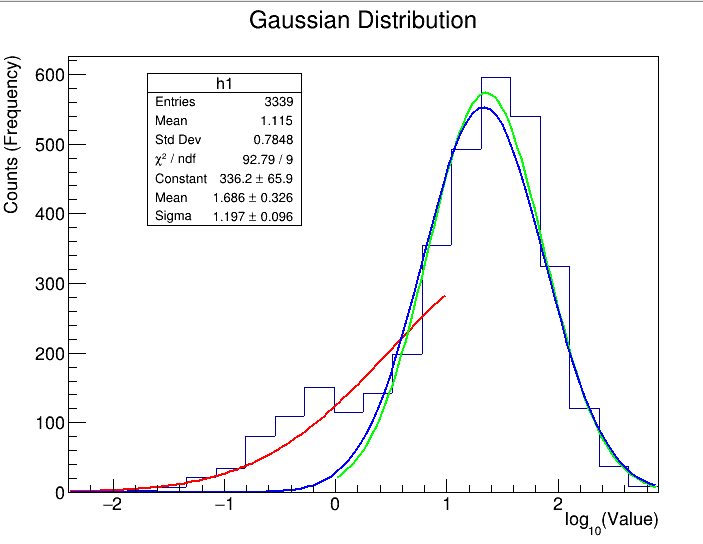
I got the plot:
In the graph, the red line does not end at xaxis. I want fit the red line into small peak around -0.2 of the histogram. How do I do that. Kindly help me.
Thanks!
Anil
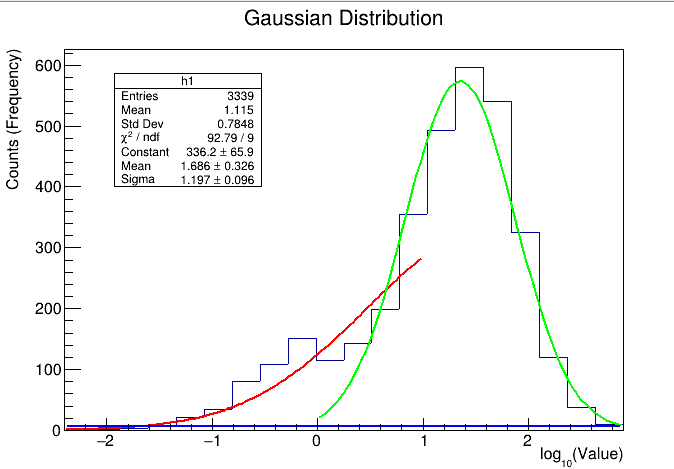
TF1 *f1 = new TF1("double_gaus", "gaus(0) + gaus(3)", -2.4, 2.9);
If I use "gaus(0) + gaus(3)". The blue line flats on xaxis and red does not change.
TF1 *g1 = new TF1("fit1", "gaus", -2.4, 0.1);
TF1 *g2 = new TF1("fit2", "gaus", 0.6, 2.9);
g2->GetParameters(&par[3]);
Here is the graph
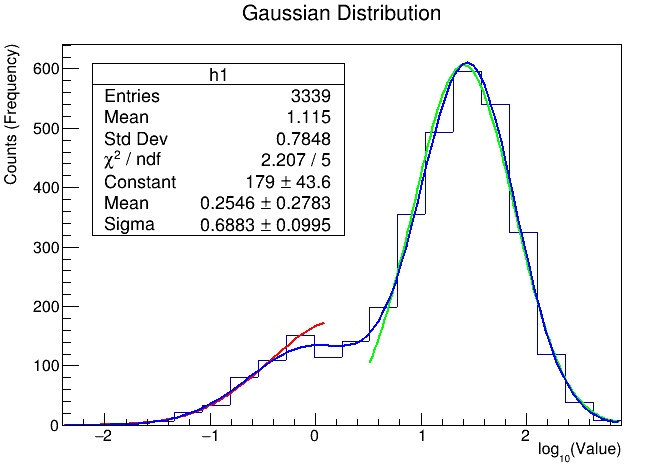
But the end and start point of red and green lines respectively are not meet to xaxis. Can we meet them?
TF1 *g1 = new TF1("fit1", "gaus", -3., 3.); h1->Fit(g1, "", "", -2.4, 0.1);
TF1 *g2 = new TF1("fit2", "gaus", -3., 3.); h1->Fit(g2, "+", "", 0.6, 2.9);
h1->Fit(f1, "R+");
g1->SetParameters(f1->GetParameters()); g2->SetParameters(f1->GetParameters() + 3);
g1->Draw("SAME"); g2->Draw("SAME"); // f1->Draw("SAME");
Thank you very much @Wile_E_Coyote