rooters,
I’d like to draw a TH1F with the option of “p”(points), AND save it into a file, not display it on the screen after running.
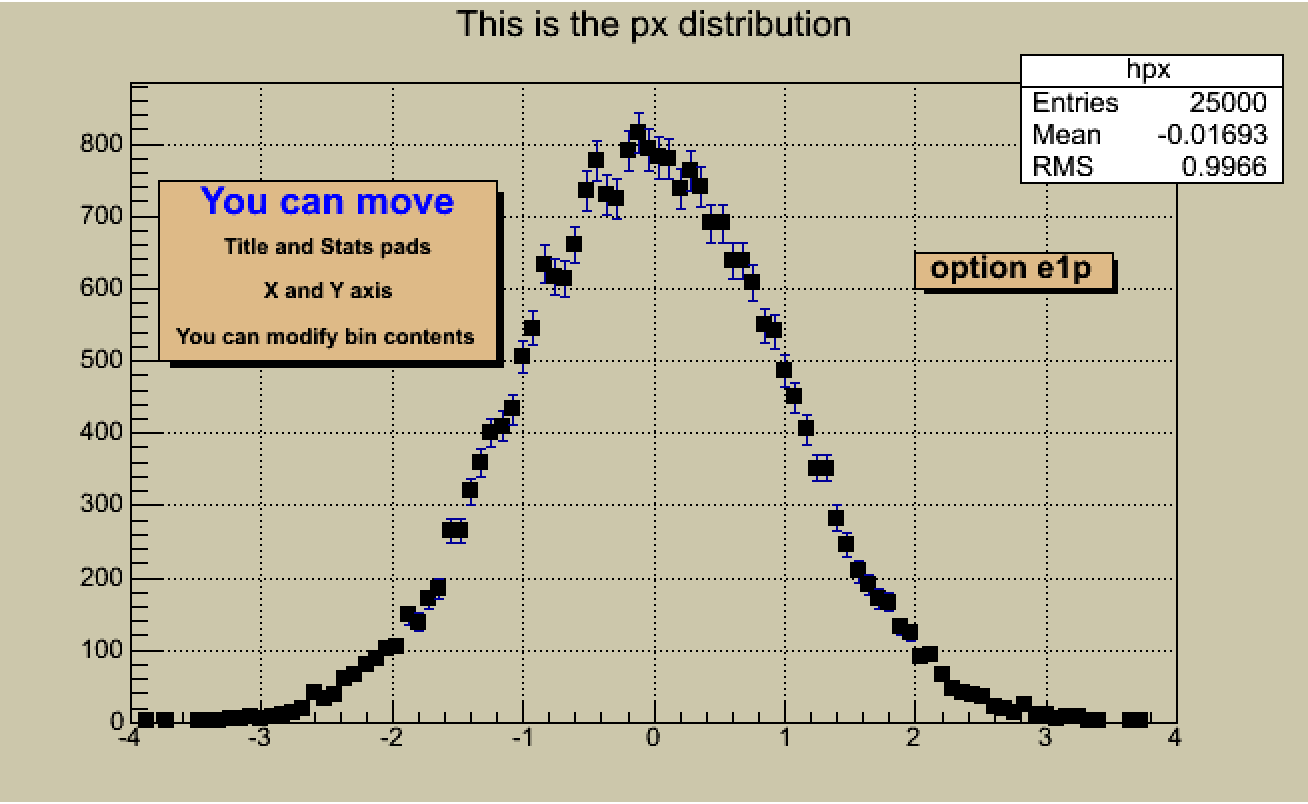
The shape of the “histogram” should look like the produced plot of h1draw.C, root.cern.ch/root/html/tutorial … raw.C.html, as attached.
My code is something like this :
{
/// Open outRoot filename to be wrote.

/// TH1F Histogram defined here ;

  {
// Fill histogram as the following lines ;

        if( outArray[i] >= peak_minus_3sigma && outArray[i] <= peak_plus_3sigma){
                h_ccd_CTE_L->SetBinContent(axisIndex, outArray[i]);
        }

  }

              h_ccd_CTE_L->Draw("p");

              h_ccd_CTE_L->GetXaxis()->SetTitle("The index of left half CCD");
              h_ccd_CTE_L->GetXaxis()->CenterTitle(true);
              h_ccd_CTE_L->GetXaxis()->SetTitleOffset(1.2);

              h_ccd_CTE_L->GetYaxis()->SetTitle("DN");
              h_ccd_CTE_L->GetYaxis()->CenterTitle(true);
              h_ccd_CTE_L->GetYaxis()->SetTitleOffset(1.45);

}
            outRootFile.Write();
            outRootFile.Close();
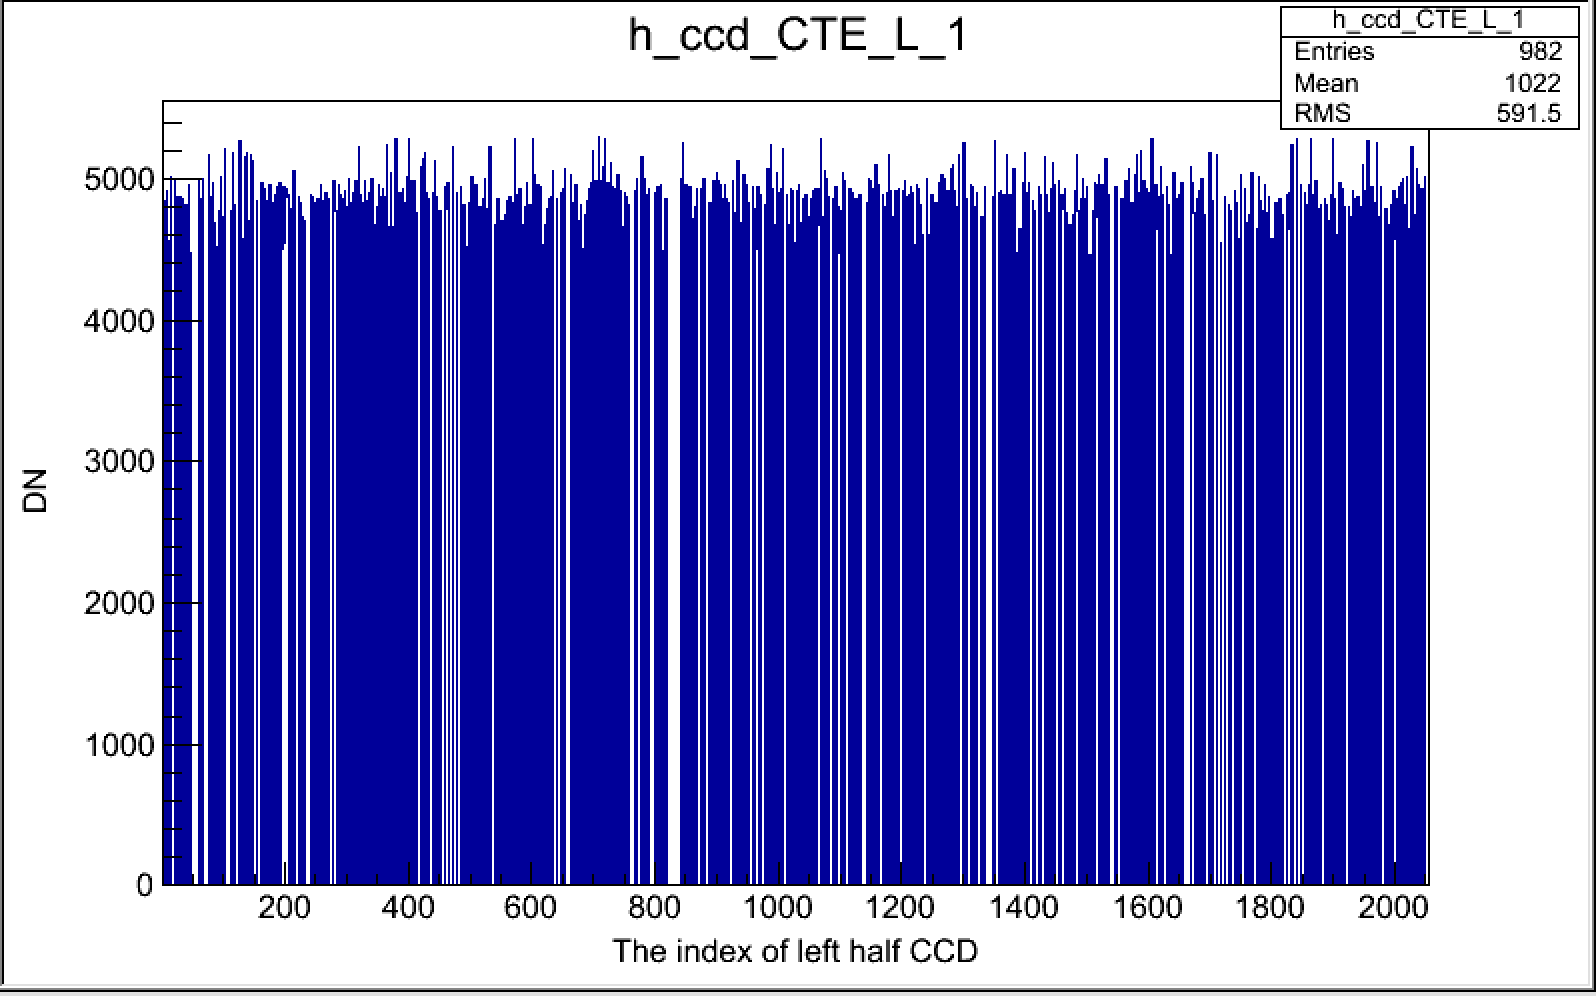
My question is : why my produced root files always shown as ''histogram", as another attachment shown, instead of “points” ?
Thanks !
Best,
Junhui
I’m afraid the last used “drawing option” is not saved together with the histogram in the root file.
So, after you open the file with your saved histogram, you probably need to h_ccd_CTE_L->Draw(“p”) it again (manually adding the “p” option).
However, you can overcome it -> just call (no need to call h_ccd_CTE_L->Draw(“p”) in your macro at all and you may simply call h_ccd_CTE_L->Draw(); afterwards):
h_ccd_CTE_L->SetOption(“p”); // set “p” the default drawing option for this histogram
Hi, Wile,
Thanks for your reply !
I’ve figured out, as following.
{
/// Open outRoot filename to be wrote.

/// TH1F Histogram defined here ;

  {
// Fill histogram as the following lines ;

        if( outArray[i] >= peak_minus_3sigma && outArray[i] <= peak_plus_3sigma){
                h_ccd_CTE_L->SetBinContent(axisIndex, outArray[i]);
        }

  }

              h_ccd_CTE_L->GetXaxis()->SetTitle("The index of left half CCD");
              h_ccd_CTE_L->GetXaxis()->CenterTitle(true);
              h_ccd_CTE_L->GetXaxis()->SetTitleOffset(1.2);

              h_ccd_CTE_L->GetYaxis()->SetTitle("DN");
              h_ccd_CTE_L->GetYaxis()->CenterTitle(true);
              h_ccd_CTE_L->GetYaxis()->SetTitleOffset(1.45);

}

              h_ccd_CTE_L->Draw();
              h_ccd_CTE_L->SetOption("e1p");

            outRootFile.Write();
            outRootFile.Close();
And the improved plot shown here also.
CTE_Fe55_LCCD_linear_fit_2p5sigma_errorbars.pdf (68.8 KB)
In this plot, I drew it in the format of “e1p” - except “p”, an error bar(“e1”) has been supplied.
The reason of adding this is I thought it will help my linear fit, as the red line on my plot shown.
Two question arises :
(1), Could you please tell me why this solution(as my new script) works ?
(2), To each point, how ROOT calculate its error bar(in both x and y directions) ?
Thanks !
Best,
Junhui
Histograms have no x-errors (unless you consider the bin width as a kind of an error).
You did not provide your histogram with y-errors so ROOT assumes that for each bin the y-error is sqrt(bin_contents).
If you want to have x- and y- errors, have a look at the TGraph derived classes -> search for “Errors” in this Index of HIST/HIST.
BTW, Just to make your macro more clear, you could swap the order of h_ccd_CTE_L->Draw(); and h_ccd_CTE_L->SetOption(“e1p”); calls (i.e. first SetOption then Draw and note that you do not need to Draw it at all if you don’t want it). Also, see the THistPainter class description for available drawing options.