Hello everyone,
I have a long list of integers from the values 1, 2, 3, and 4.
I try plotting a histogram of the data using.
TH1* h_mult = new TH1I("h_mult", "Multiplicity", 5, 0, 5);
Then use the baroption to draw it, `h_mult->Draw(“bar”)
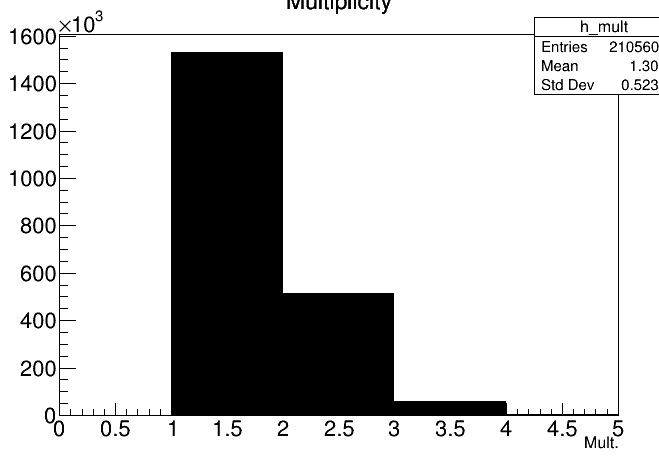
`
However, I cannot control the X-axis values such that the first bar is centered at x =1, the second bar at x =2, the third at x=3, and the fourth at x =4. Also, can only the labels x = 1,2,3 and 4 be displayed and not the intermediate values on the axis?
Can someone please help me in this regard? I think I know that what I am trying to get is a 'bar plot, ’ but I am unable to adjust the X-axis values.
Thanks in advance!