Please read tips for efficient and successful posting and posting code
Please fill also the fields below. Note that root -b -q will tell you this info, and starting from 6.28/06 upwards, you can call .forum bug from the ROOT prompt to pre-populate a topic.
ROOT Version: 6.30/04
Platform: windows11
Compiler: MSVC 19.29.30154.0
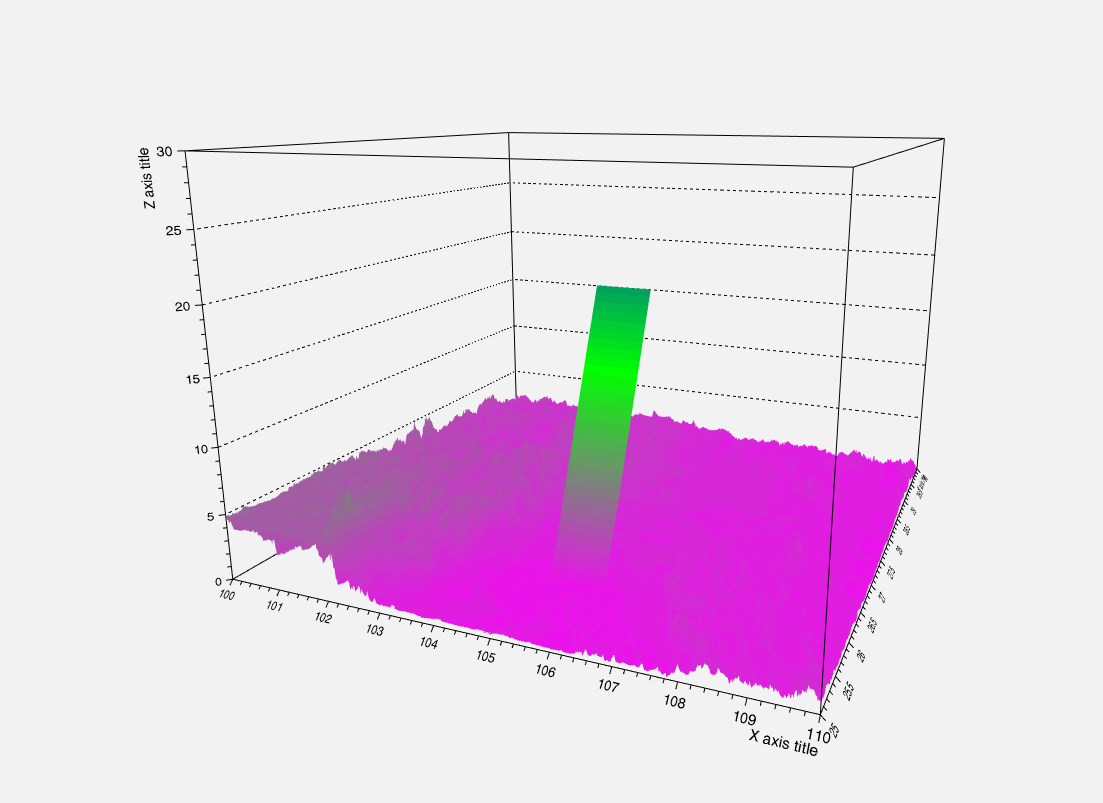
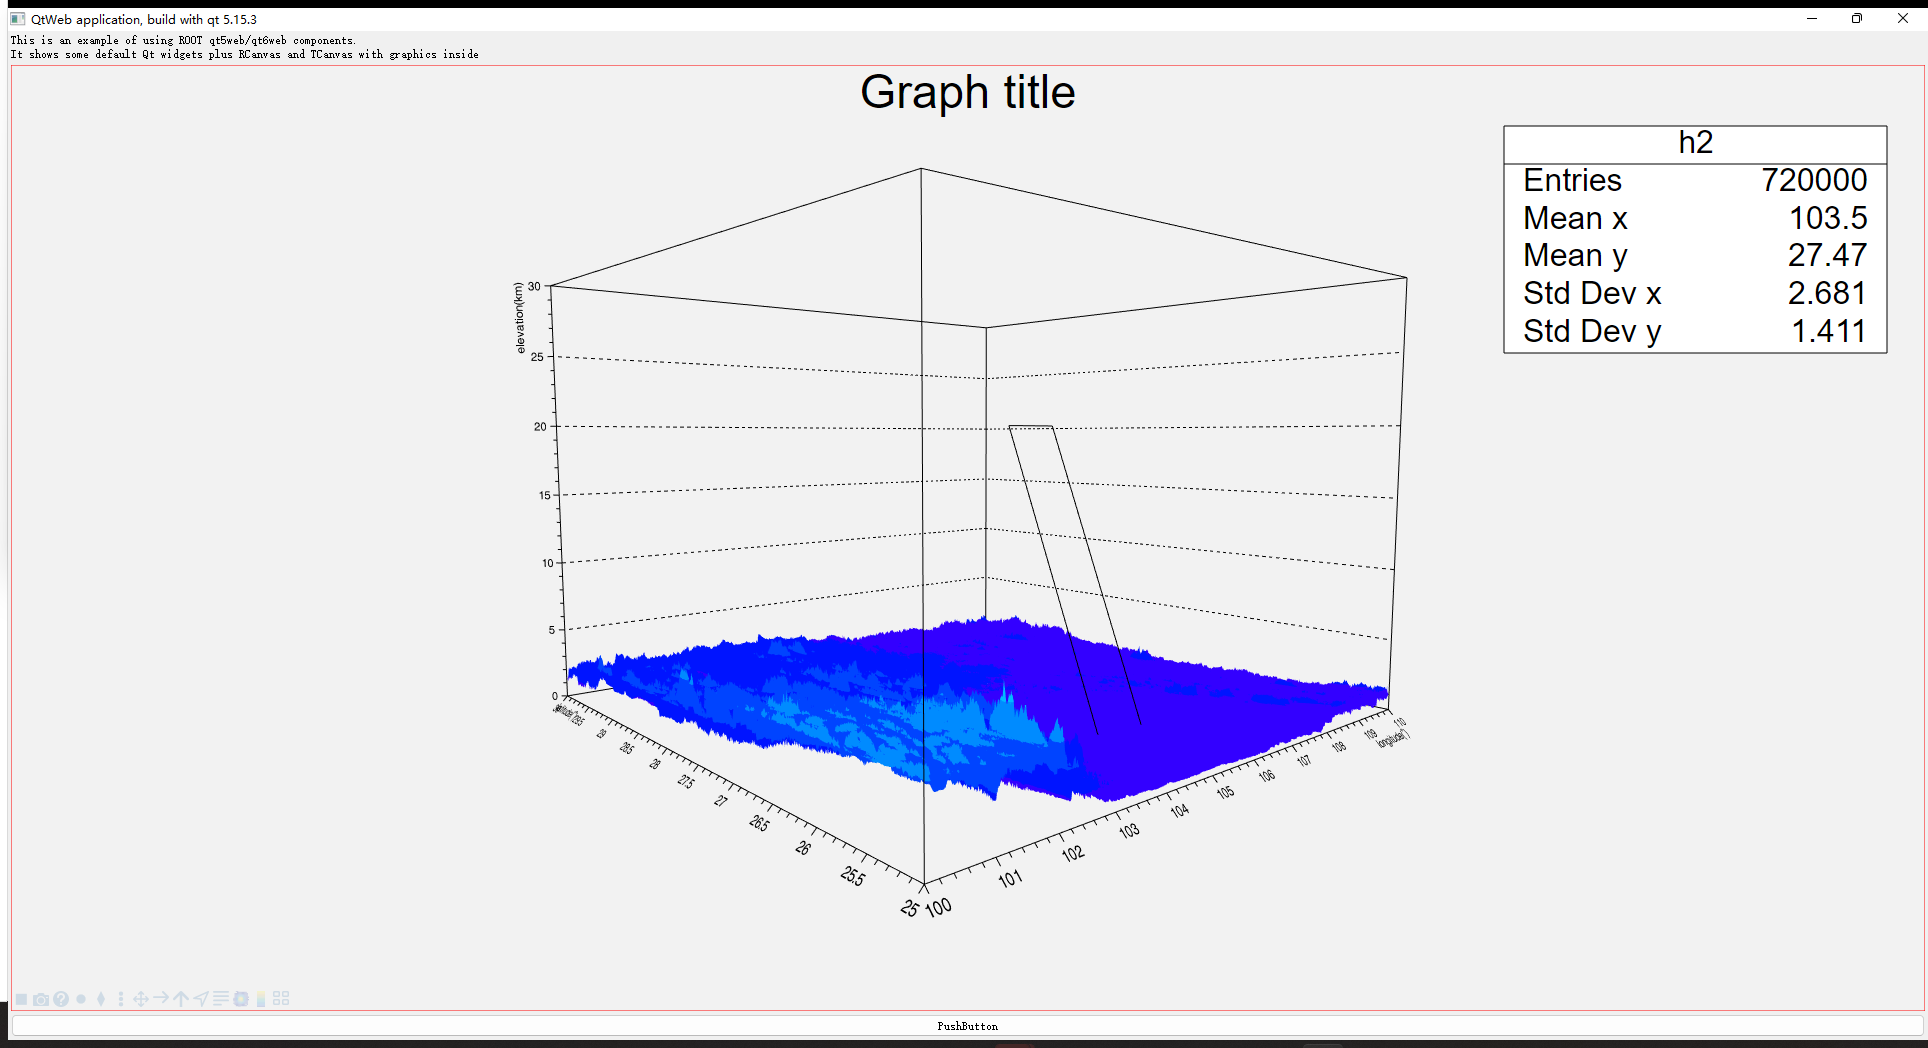
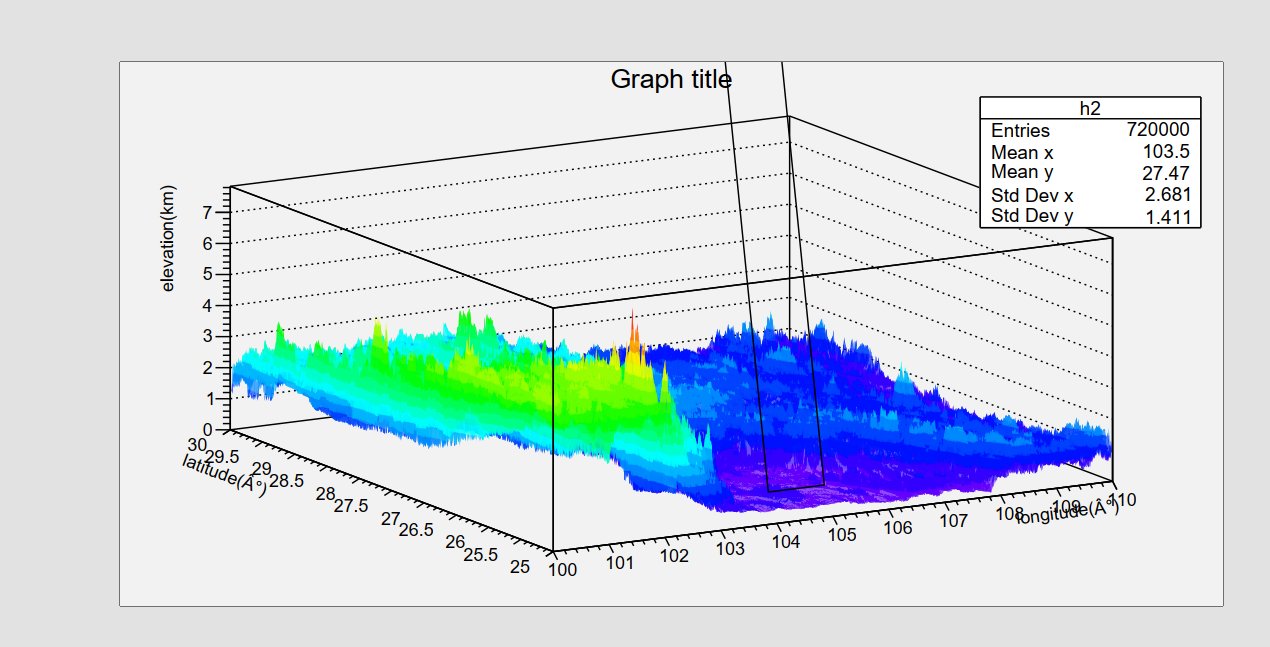
I now want to draw a 3D elevation data and overlay some polygons. I have now implemented the drawing of elevation data through H2F, but now there are two problems:
- How do I customize the color palette and apply it to the Z value.
- How do I draw polygonal data in a chart?
My code is like this:
float* pBuf = new float[nXSize * nYSize];
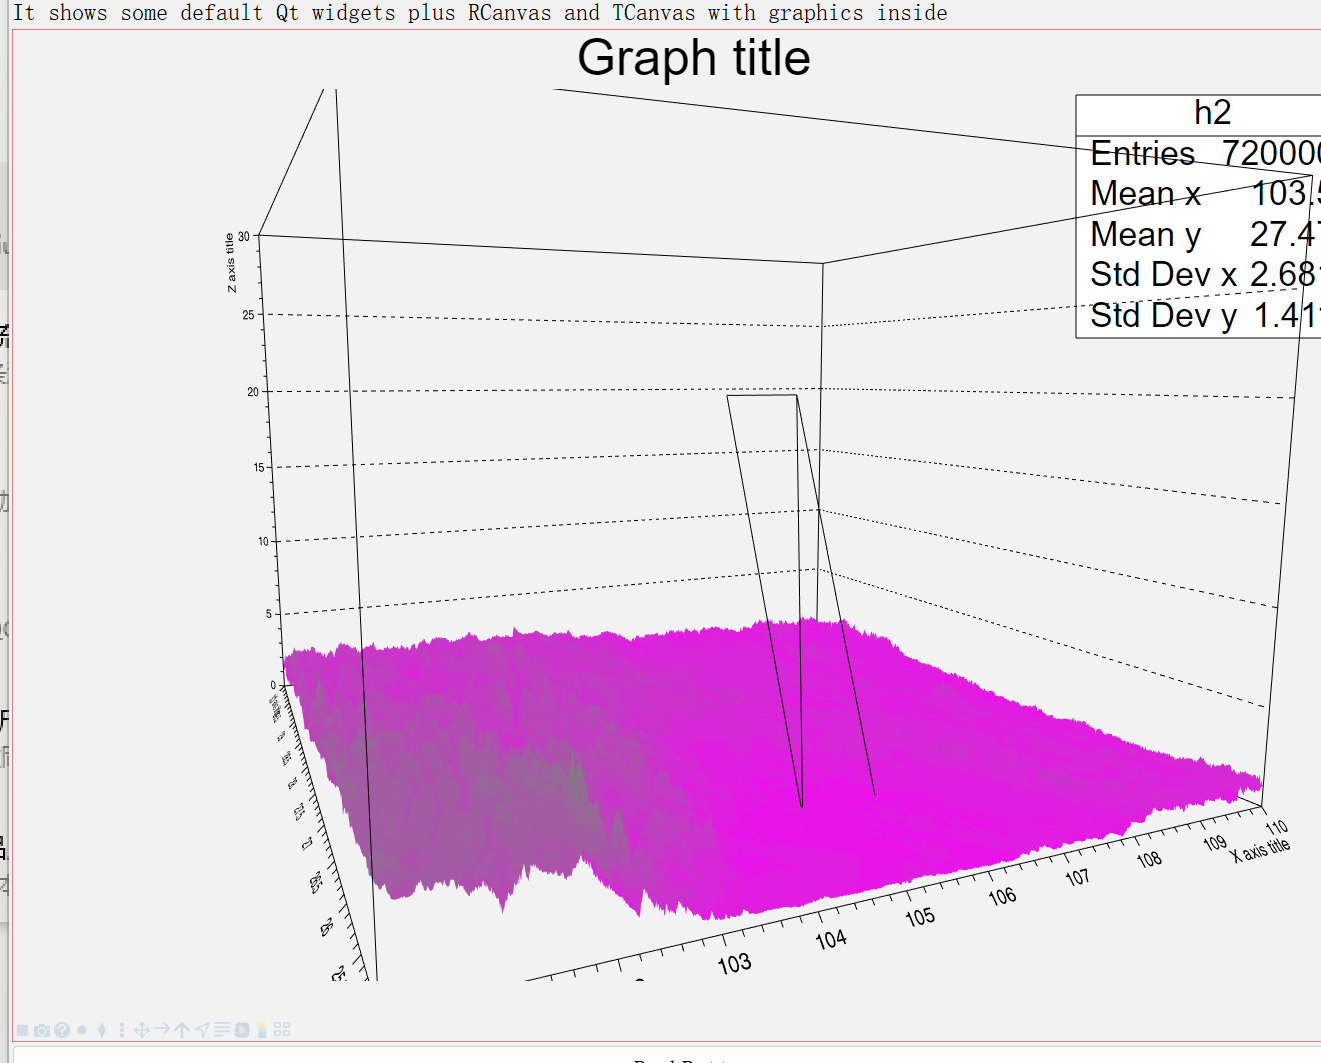
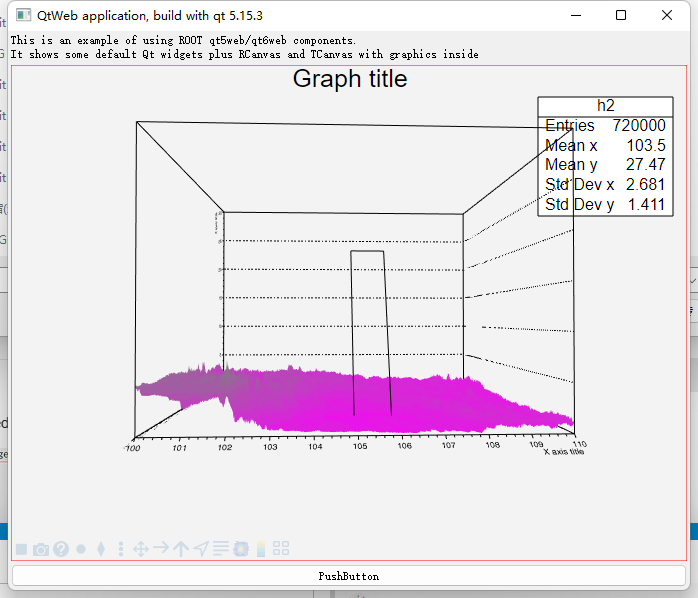
TH2F* dt = new TH2F("h2", "h2", nXSize, 100, 110, nYSize, 25, 30);
dt->SetTitle("Graph title; X axis title; Y axis title; Z axis title");
Int_t N = 0;
for (size_t i = 0; i < nYSize; i++)
{
y = i;
for (size_t j= 0; j < nXSize; j++)
{
x = j;
Int_t bin = dt->GetBin(j + 1, i + 1);
z = pBuf[i * nXSize + j];
dt->SetBinContent(bin, z/1000.0);
}
}
dt->SetMinimum(0);
dt->SetMaximum(100);
Double_t Red[3] = { 1.00, 0.00, 0.00 };
Double_t Green[3] = { 0.00, 1.00, 0.00 };
Double_t Blue[3] = { 1.00, 0.00, 1.00 };
Double_t Length[3] = { 0.00, 0.50, 1.00 };
Int_t nb = 50;
TColor::CreateGradientColorTable(3, Length, Red, Green, Blue, nb);
dt->SetContour(nb);
gStyle->SetPalette(1);
dt->Draw("surf4");
Hope to get your help