Hi,
I have written a macro to plot two histograms on the same plot. The first histogram is plotted from a TTree and the second result need to be plotted from a .dat file with two columns (namely the mass and yield).
{

TFile *file3=TFile::Open("RAW173.root");
TTree *tree3=(TTree*)file3->Get("Analysis");


   TH1D*h1 = new TH1D("h1","Normalised to the total number of events",100.,40.,140.);
   h1->SetLineColor(8);
   h1->SetLineStyle(1);
   h1->SetLineWidth(3);
   tree3->Draw("M_Tot>>h1","","goff");
   s1 = 6./11620.;   // Normalised to amplitud of the histogram
   h1->Scale(s1);
   h1->Draw("");

  TTree *MyTree = new TTree("MyTree", "MyTree");
  MyTree->ReadFile("yield176_40.dat", "Mass:Yield"); // the .dat file has two coloums (mass and the corresponding yeilds )and I would like to plot a 1D histogram but I dont know how
  MyTree->SetEstimate(MyTree->GetEntries());
  TH2F *MyHisto = new TH2F("MyHisto", ";Fragment Mass Number [amu];Yield (%)", 100, MyTree->GetMinimum("Mass") - 1, MyTree->GetMaximum("Mass") + 1, 100, MyTree->GetMinimum("Yield") - 1, MyTree->GetMaximum("Yield") + 1);
  MyTree->Project("MyHisto", "Yield:Mass");
 MyHisto->Draw("SAME");

  auto legend = new TLegend(0.1,0.5,0.4,0.6);
   legend->SetHeader("","C");
   legend->AddEntry(h1,"176_Os_Ex_Exp=64.8 MeV, Eff_Ex~40MeV","l");
   legend->AddEntry(MyHisto,"176_Os_Ex_K=40 MeV","l");
   legend->SetBorderSize(0);
   legend->Draw();
}
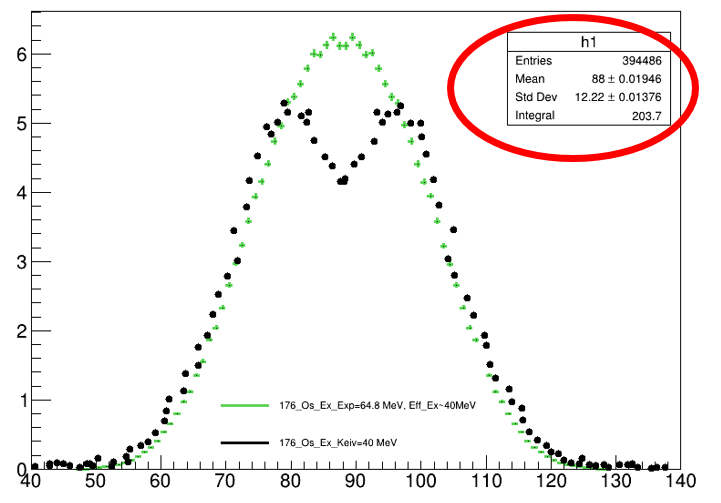
So when I run this macro I have the histogram details of the first histogram h1 but I would like to display the entries, std dev and intergral of the second histogram MyHisto.
Could some one please let me know how to do this.
Please read tips for efficient and successful posting and posting code
ROOT Version: Not Provided
Platform: Not Provided
Compiler: Not Provided