Hello,
I have a macro to output a file with a tree and branches but I keep running into faults (corrupted size vs. prev_size) which I’ve read online are related to memory allocation. I am using vectors, .push_back, and then accessing elements but I have several checks in place to ensure I don’t access the wrong elements. Furthermore, I try commenting code to see where the problem is and a simple integer that gets iterated and reset every event seems to be the problem (but I doubt it).
I was wondering how I runa debugger? I’m not very familiar with dbg but I’ve seen it mentioned on this forum.
I’m running Ubuntu 18.04.5 (in a VM) with root 6.24/02. I installed it by unzipping the file on the website and the doing
source /root/bin/thisroot.sh
I also added the above line to my .bashrc so I don’t have to run it all the time.
When I try and run the debugger using something like
dbg root
it doesn’t seem to recognise root?
ROOT Version: 6.24/02 Platform: Ubuntu 18.04.5 Compiler: gcc I think? How do I check?
Note that it’s spelled gdb, not dbg, and you’ll have best results if you tell ROOT to add debug symbols to your program. Typically, for debugging, I prefer compiling the program with g++ and run the debugger on the executable, but if you want to do it through the ROOT interpreter this works fairly well for me:
$ gdb --quiet --args root.exe -l -b -q foo.C+g
Reading symbols from root.exe...
(gdb) break foo()
Function "foo()" not defined.
Make breakpoint pending on future shared library load? (y or [n]) y
Breakpoint 1 (foo()) pending.
(gdb) run
Starting program: /home/blue/ROOT/relwithdebinfo/_build/bin/root.exe -l -b -q foo.C+g
Processing foo.C+g...

Breakpoint 1, foo () at /tmp/./foo.C:2
2	   int a = 42
(gdb)
If you prefer a visual/interactive debugger, I would recommend you to use QtCreator, that way you can run ‘gdb’ behind the scenes and set breakpoints clicking on the source code itself.
I also try to build ROOT in ‘Debug’ mode so that the debug messages are more representative and code lines are reported.
To build ROOT using QtCreator, you can click on Open File or Project, and double click on CMakeLists.txt of root-source git repo. On Build icon (left), switch to Debug instead of Release. When built, go to run, and select your target (root.exe) and specify the command line arguments to run your script, optionally click on “Run in terminal”.
Thank you all so much for your help! This was super helpful! I ended up also using valgrind after realizing gdb doesn’t help too much with memory issues, but for future debugging this was really really helpful! Thanks again!
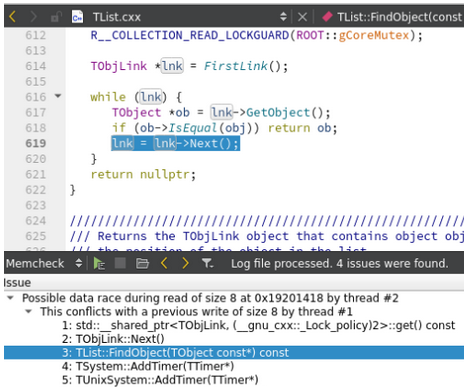
Side note: you can also run valgrind within QtCreator (called Memcheck in the dropdown menu). It formats very nicely the output log and you can click to find the problematic place in the code.