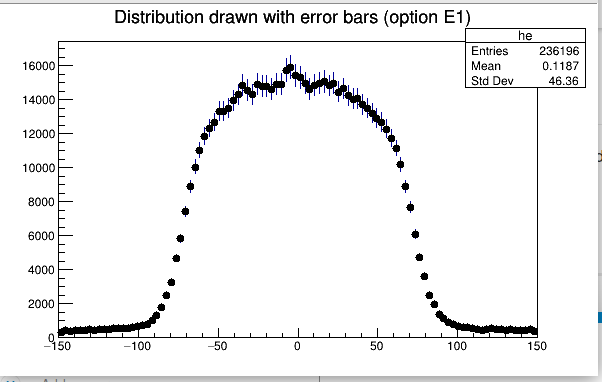
hello, I have a problem in range of the Y axis, I have two column x varies between -148.5 to 148.5 and Y varies between 0 to 100, but as you see in the figure the y axis varies length until to 16000.
here is the script.C that I use:
#include “Riostream.h”
void rt1()
{
TString dir = gSystem->UnixPathName( **FILE** );
dir.ReplaceAll(“rt1.C”,"");
dir.ReplaceAll("/./","/");
ifstream in;
in.open(Form("%sq20.txt",dir.Data()));
Float_t x,y;
Int_t nlines = 0;
TCanvas *c1 = new TCanvas(“c1”,“c1”,600,400);
TH1F *he = new TH1F(“he”,"Distribution drawn with error bars (option E1) ",100000,-150,150);

while (1) {
in >> x >> y;
if (!in.good()) break;
if (nlines < 350000) printf(“x=%8f, y=%8f\n”,x,y);
nlines++;
he->Fill(x,(y/5.23E-07) 100);
}
gStyle->SetEndErrorSize(3);
gStyle->SetErrorX(1.);
he->SetMarkerStyle(20);
he->Draw("</em> ");
return c1;
}
ROOT Version: Not Provided
Platform: Not Provided
Compiler: Not Provided
I don’t know what this is supposed to do:
But this is definitively not correct. And please read this to learn how to format your code
thank you for your answer,
(y/5.23E-07) 100) : i has divide each value of y on the maximum value and multiply in 100
Then could you attach your macro and your data file? I see several oddities in the code you posted…
you have multiple lines with the same x, they’re added up in y for each bin when you fill
yes that’s the problem, is there a way to plot this file?
Depends on what you want to do exactly? It could be that the way you’re plotting it is correct…
Looks like a Y/eta distribution to me, and weights are MC weights?
Sorry, just realize your x axis spans to 100, which cannot be eta
I want to plot the second column (Y-axis) of file q18.txt according to the first column (X-axis). but as you see I converted the column of the Y-axis in percentage in the code by Fill (x, (y / 5.23E-07) * 100). can it be a problem?
You have multiple entries with exactly the same x, but different y. In this case, you’re not getting a 1-1 correspondence. You’re not getting a function from the txt. That’s what I mean what you want to do exactly.
Do you want the points with the same x to add up in y?(that’s what you’re doing)
Or do you want to have average y at each x? Then you can use TProfile for the purpose.
When you fill an histogram, you can fill several time in the same bin. This is what happens in your case. Giving a weight (the second argument) doesn’t scale the histogram to the value you expect.
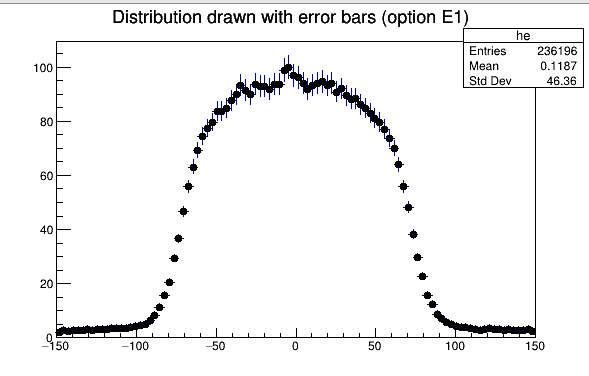
Even if I don’t really understand why you want to have a maximum at 100, You can try something like this:
#include "Riostream.h"

TCanvas *rt1()
{
   ifstream in;
   in.open("q18.txt");
   Float_t x,y;
   Int_t nlines = 0;
   TH1F *he = new TH1F("he","Distribution drawn with error bars (option E1)  ",100,-150,150);

   while (1) {
      in >> x >> y;
      if (!in.good()) break;
      he->Fill(x, y);
   }
   TCanvas *c1 = new TCanvas("c1","c1",600,400);
   gStyle->SetEndErrorSize(3);
   gStyle->SetErrorX(1.);
   he->Scale(100.0/he->GetMaximum());
   he->SetMarkerStyle(20);
   he->Draw("*");
   return c1;
}
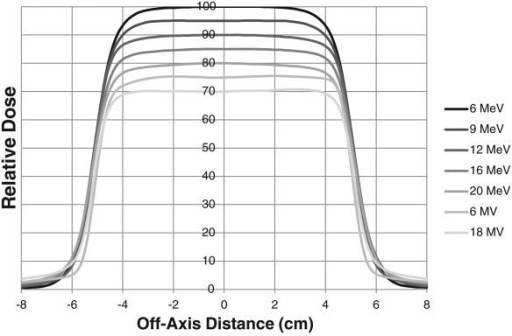
because I plot the percentage of dose according to their distribution, ie that is the maximum value of the Y axis must not exceed 100% and when I want to compare this result with other it’s be logical. lwill be like this:
Then you most probably need a TGraph (or TGraphError) and not an histogram…
And BTW, it looks like your .txt file has several series of data between [-150 150]. So you’ll need a more complex algorithm to read&plot your data than the while loop you’re currently using. And you also have several y values for the same x value… I don’t see how you can fix this
yes that’s the problem in data file contains several values y for the same value x which repeats I tried with TGraph but it not works I do not know is what there are methods for this in TGraph ?
Well, there is no magic method to know what to do with several y values for the same x value… You have to know how to handle your data (and probably create several TGraph with your series)
ok, by histogram, it will not be true to plot this q18.txt file from the code you have shared ?
Well, I don’t know, I guess you should know what your data file contains, or at least someone should know. Where is this file coming from?
this file is stimulated by geant4. I simulate the dose distribution in a phantom of dimension 150 * 150 * 15
OK, fine, but then the output is probably not at the correct format (missing precision in the x values)