how the tmva bdt classifier returns the number of events for bdt score valued ,i am getting very small number of events for bdt score values ,that i want to change .
Hi,
I am sorry I have not understood your questions. Are you asking about the returned histogram showing the BDT scores ? Are you looking at the training or or at the test data set ?
If you have a small number of events it is because you are maybe using a very small numbers ?
It is also possible you are using weights.
Please explain better the problem and post code/ plots/ whatever needed to clarify this better
Cheers
Lorenzo
Thank you so much for your effort in trying to understand my queries.
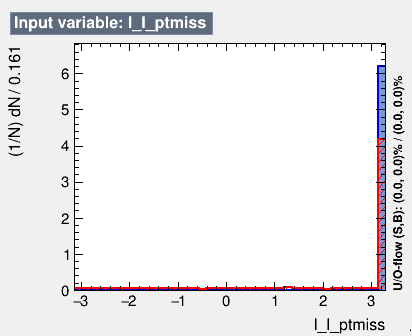
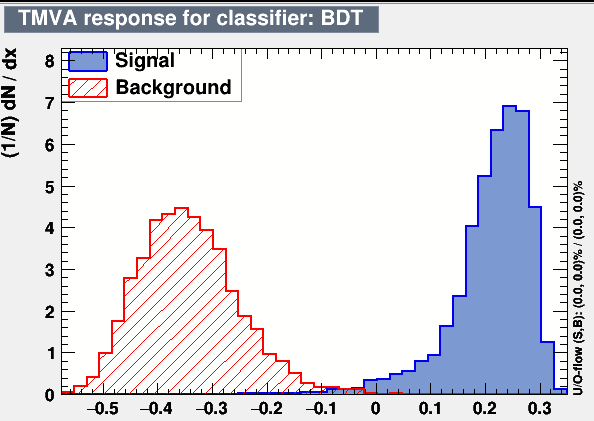
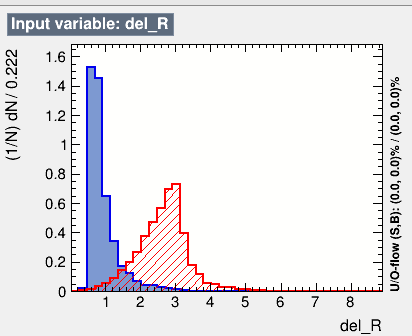
I have one signal tree and 3 background trees,all of them have 10000 events.the events were generated using madgrah.now in 2 graphs of variable y-axis is not properly normalized.i guess it should give y value less than one according the label.same for the classifier response distribution graph,where number of events are appearing in the range from 0 to 9. I am using tmvaclassification.C code.
I’m relatively new to TMVA and still in the learning phase. I would appreciate your guidance and assistance as I navigate through the tool and explore its features."
Hi,
The plots are normalised to show 1/N * dN/dX. So if you compute the integral of your response histogram it will be equal to one. If you are interested by the total number of events in each single bin, you need to multiply the shown histogram by the number of events (signal or background) and the bin width.
Lorenzo
"I’m really grateful for your suggestion. It clicked with me, and I now understand how it works. Thank you