I am testing out the add function on TProfiles to see how it works. Below, I create a profile with all y values at 10 and another profile with all y values at 5. I then subtract the second profile from the first profile using the TH1 Add function by giving the second profile a weight of -1. I expect a profile with y mean of 5.
{
	TProfile* profile1=new TProfile("profile1","profile1",10,0,10);
	for(int i=0; i<10; i++){
		for(int q=0;q<100; q++){
			profile1->Fill(i,10);
	}}
	TProfile* profile2=new TProfile("profile2","profile2",10,0,10);
	for(int i=0; i<10; i++){
		for(int q=0;q<100; q++){
			profile2->Fill(i,5);
	}}
	TProfile *subtraction=new TProfile("subtraction","subtraction",10,0,10);
	subtraction->Add(profile1, profile2,1,-1);
	subtraction->Draw();
}
Instead, I get the attached profile. The info box in the upper right claims mean y is 7.5 even though the profile itself is clearly centered at y of 2.5. Neither of these results make sense to me, since I expected mean y to be 5.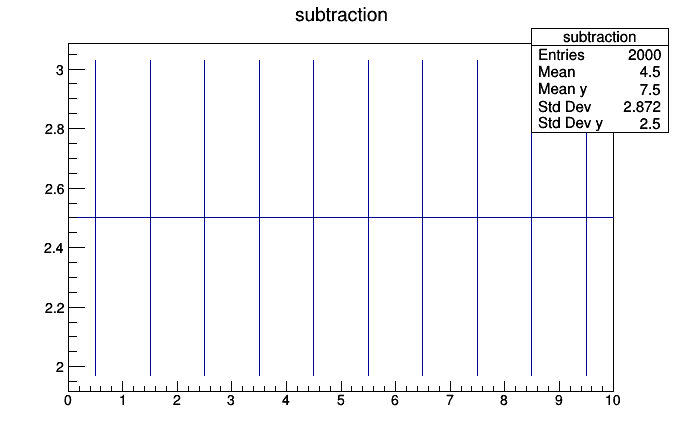
Please read tips for efficient and successful posting and posting code
ROOT Version: 6.20.06
Platform: Windows 10
Compiler: Not Provided