Hi experts!
I have already drawn the histogram, and I want to fit that histogram. I am trying to fit the gaus+pol2 function. How do I write the command?
root [0]
Attaching file y_pro_C2_1544.root as _file0…
(class TFile ) 0x30e6c10
root [1] .ls
TFile* y_pro_C2_1544.root
TFile* y_pro_C2_1544.root
KEY: TH1F hdet_y;1
root [2] hdet_y->Draw()
Info in TCanvas::MakeDefCanvas: created default TCanvas with name c1
root [3]
Sorry, I was too fast in my reply.
You need first to create a TF1 object and then pass it when fitting. The syntax above works only for simple pre-defined functions, that have their name equal to the formula expression.
So you need to do:
TF1 * f1 = new TF1("f1","gaus(0)+pol2(3)");
f1->SetParameters(initParams);  // set initial parameters.
hdet_y->Fit(f1);
You need to write (0) and (3) to indicate that the functions do not share any parameter.
The gaus function has 3 parameters and gaus(0) means that the parameters will be p0,p1 and p2 . pol2 has also 3 parameters , but by writing pol(3) the 3 polynomial parameters will be p3,p4 and p5.
You can always check the function formula by doing f1->Print("V") that will print the full implementation of the function.
Note you need also to set some initial parameters in order the fit to work. For example, this will work for a Gaussian of mean ~ 0 and sigma ~ 1. double initParams[] = {1, 0, 1, 1, 1, 1 };
I want the fitting result as above, but when I follow the command as it is, it comes out as if it was only fit for pol2. What should I do?
And I’m not sure why you need to define the initial parameters.
The initial parameters are needed in order to have a good starting point for the iterative minimization used in fitting.
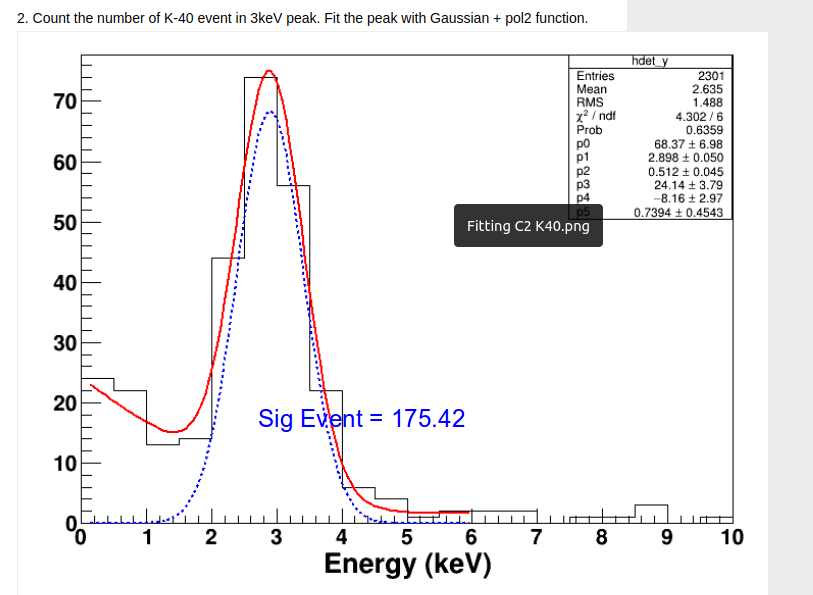
You can use the values from the good fit above, double initParams[] = { 68.37, 2.9, 0.51, 24.1, -8.2, 0.74 };
or you can fit first with a gaussian and then use the obtained gaussian parameter as initial parameters for the gaussian + polynomial fit.
As shown in the plot above, you should fit in a restricted range in Energy, e.g. [0,6].
For this you should do:
double initParams[] = { 68.37, 2.9, 0.51, 24.1, -8.2, 0.74 };
But i’m still don’t know why i set the initial parameters and i can’t understand where the values of those parameters come from.
hdet_y->Fit(f1, “”, “”,0., 6.)
And in this line, why did you put " “,” " in?
The values comes from the screenhot of the fit above. But if you don’t know, you can for example estimate the gaussian parameters with an initial gaussian only fit.
For using a restricted fit range, see the documentation of TH1::Fit.