Hello everyone!
I have information about hits in the sensitive detector: position and deposited dose corresponding to each hit which are saved in a 3D weighted histogram (dose is the weight). I have two questions regarding histograms on ROOT.
- I want to plot a 2D dose distribution at several depths along Z-axis (see example below):
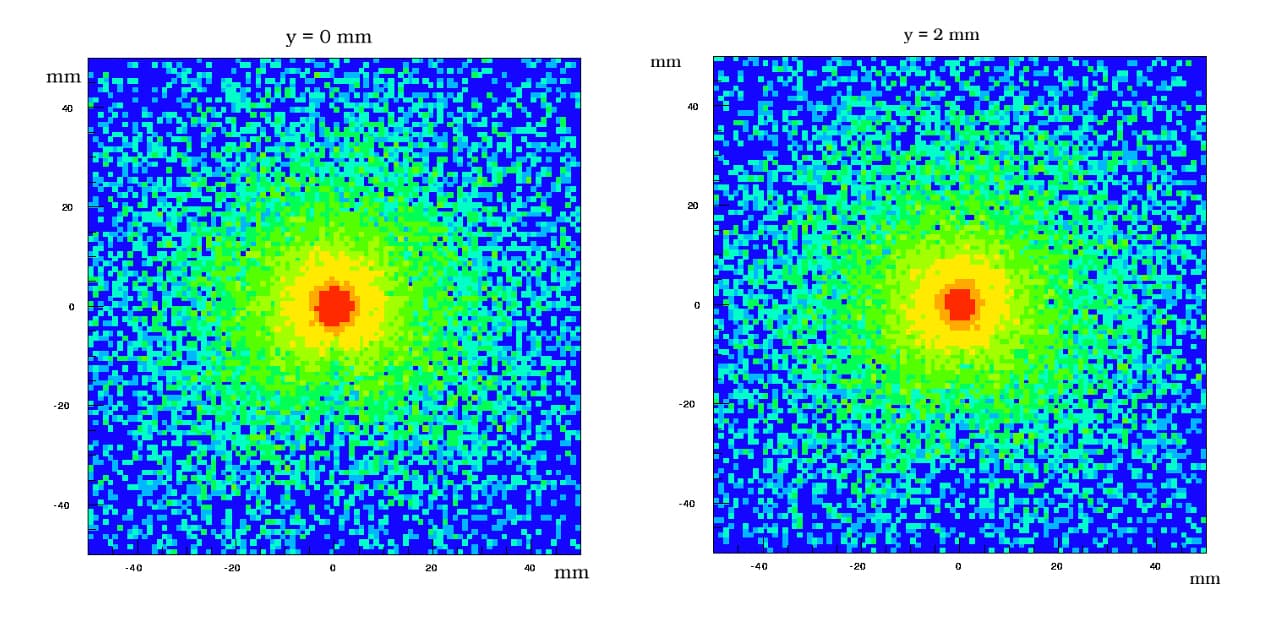
What I do is I select, for example, the first bin along the z-axis and I do a “yx” projection of my 3D histogram:
h1->GetZaxis()->SetRange(0,1)
TH2D* h2 = (TH2D*) h1->Project3D(“yx”)
h2->Draw(“colz”)
However, I am bothered by the fact that I do it in quite a cumbersome way. Is there a more nice and straightforward way to extract such 2D histogram (I am afraid I am doing it wrong selecting one bin along the z-axis etc…)
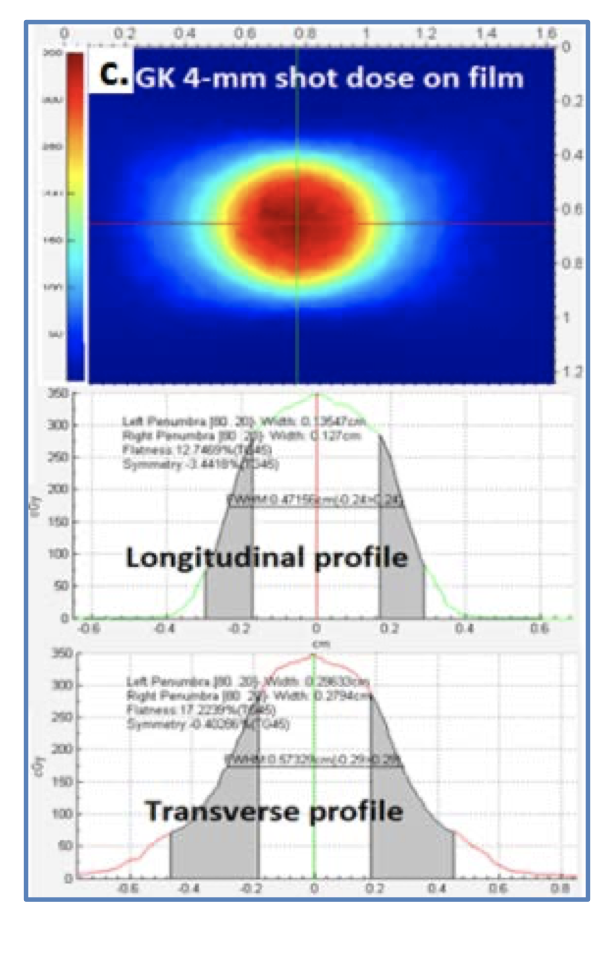
The other question is about dose profiles (see picture below). I need to get not a projection on the X axis (this is feasible) but rather a dose profile along two perpendicular lines. My idea is again select z- and y- bins in a small region around the x-axis and make a 1D projection, however, the results seem wrong to me… Is there a way to get such profiles through TH1 class commands?
Thank you very much in advance!
Kind regards,
Vasily
Please read tips for efficient and successful posting and posting code
ROOT Version: Not Provided
Platform: Not Provided
Compiler: Not Provided