Dear Rootians,
I am trying to fit the histogram for invariant mass of two leptons (Z->ee) with likelihood fit.
I have two different distribution based on sign of electron i.e Same-Sign(SS) and Opposite Sign(OS).
I have tried different function e.g Gaussian+polynomial, Lorentzian, Voigt, DS-CB etc.
For Same Sign distribution, got good fit with Voigt function.
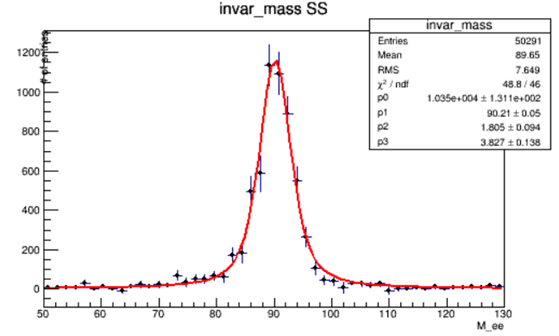
The function and results:
root [2] TF1 *f1 = new TF1("f1","([0] * TMath::Voigt(x[0] - [1], [2], [3], 4))", 50,130);
root [3] f1->SetParameters(10000, 90,2,3);
root [4] invar_mass->Fit("f1","WLR", "ep");

****************************************
Minimizer is Minuit / Migrad
MinFCN                    =      272.163
Chi2                      =      48.8082
NDf                       =           46
Edm                       = 7.15068e-008
NCalls                    =           91
p0                        =        10345   +/-   425.092
p1                        =       90.205   +/-   0.162891
p2                        =      1.80446   +/-   0.374657
p3                        =      3.82712   +/-   0.528939
But for OS distribution the Chi2 value is very high. With same function
root [2] TF1 *f1 = new TF1("f1","([0] * TMath::Voigt(x[0] - [1], [2], [3], 4))", 50,130);
root [3] f1->SetParameters(26000000, 90,0.001,4);
root [4] invar_mass->Fit("f1","WLR", "ep");
Warning in <ROOT::Math::Fitter::ApplyWeightCorrection>: Covariance matrix for weighted likelihood is not accurate, the errors may be not reliable
Error in <TMinuitMinimizer::GetHessianMatrix>: Hessian matrix has not been computed - status 1
Error in <ROOT::Math::Fitter::ApplyWeightCorrection>: Error retrieving Hesse on weight2 likelihood - cannot compute errors
Warning in <Fit>: Abnormal termination of minimization.

****************************************
Minimizer is Minuit / Migrad
MinFCN                    =       162202
Chi2                      =      22154.4
NDf                       =           46
Edm                       = 1.42054e-011
NCalls                    =          102
p0                        = 2.61392e+007   +/-   6592.51
p1                        =      90.8288   +/-   0.000865041
p2                        =   0.00102603   +/-   1.22141e-008
p3                        =      4.68913   +/-   0.00162434
Also tried with Lorentzian function …Which give same chi2 value
root [2] TF1 *f1 = new TF1("f1","((0.5*[0]*[1]/TMath::Pi()) / TMath::Max( 1.e-10,(x[0]-[2])*(x[0]-[2]) + .25*[1]*[1]))", 10,170);
root [3] f1->SetParameters(2.61516e+07, 4,90);
root [4] invar_mass->Fit("f1","WLR", "ep");
Warning in <ROOT::Math::Fitter::ApplyWeightCorrection>: Covariance matrix for weighted likelihood is not accurate, the errors may be not reliable
Warning in <ROOT::Math::Fitter::ApplyWeightCorrection>: Covariance matrix for weighted likelihood was forced to be defined positive

****************************************
Minimizer is Minuit / Migrad
MinFCN                    =       162202
Chi2                      =      22154.4
NDf                       =           47
Edm                       = 1.75801e-010
NCalls                    =           78
p0                        = 2.61392e+007   +/-   61291.9
p1                        =      4.68913   +/-   0.0141233
p2                        =      90.8288   +/-   0.0078541
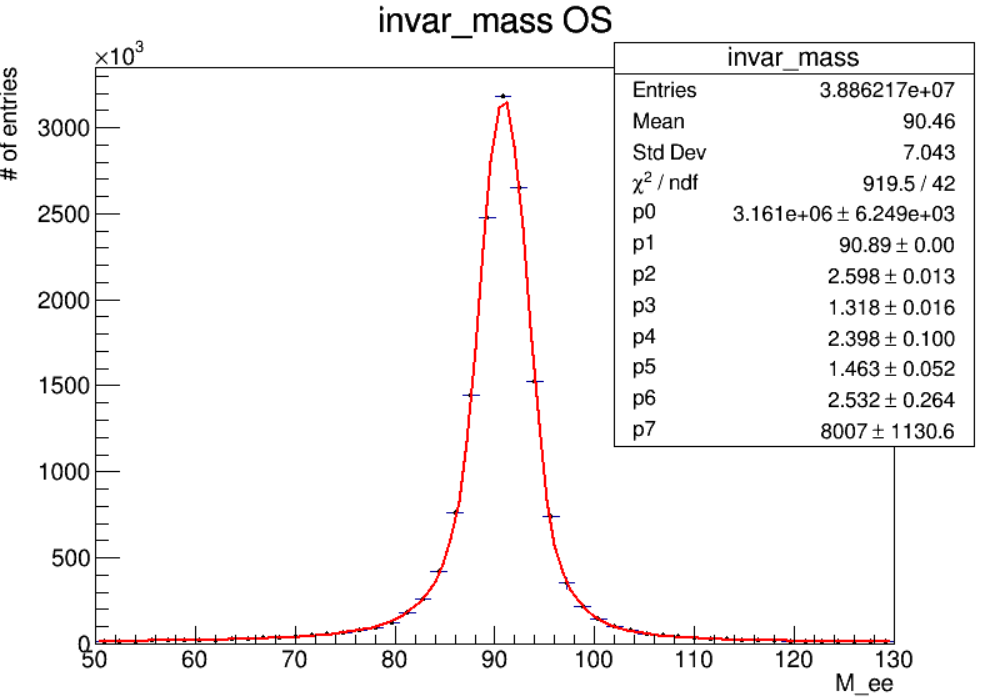
Then I tried double-sided CB function to fit the OS distribution. The fit results are without any error or warning, but still have the Chi2 = 1044.79
****************************************
Minimizer is Minuit / Migrad
MinFCN                    =      8047.47
Chi2                      =      1044.79
NDf                       =           42
Edm                       =  5.06269e-09
NCalls                    =          801
p0                        =  3.11001e+06   +/-   7191.01
p1                        =      90.8832   +/-   0.00604309
p2                        =      2.64637   +/-   0.0170922
p3                        =      1.31658   +/-   0.019208
p4                        =       2.4644   +/-   0.116622
p5                        =      1.45723   +/-   0.0616649
p6                        =      2.63389   +/-   0.307276
p7                        =      8530.86   +/-   1179
Dose the last fit (with DS-CB) gives the good results? Or should I try to fit the Opposite- Sign distribution with some other function? although the fit result are shown without any error/ warning but Chi2 value is still very high. Or I need to check for some other test than the Chi2 to check the fit is good or not?
Many thanks
(I have also attached the histogram for SS and OS)
Zjets_SS.root (4.4 KB)
zjets_OS.root (4.4 KB)