Hey,
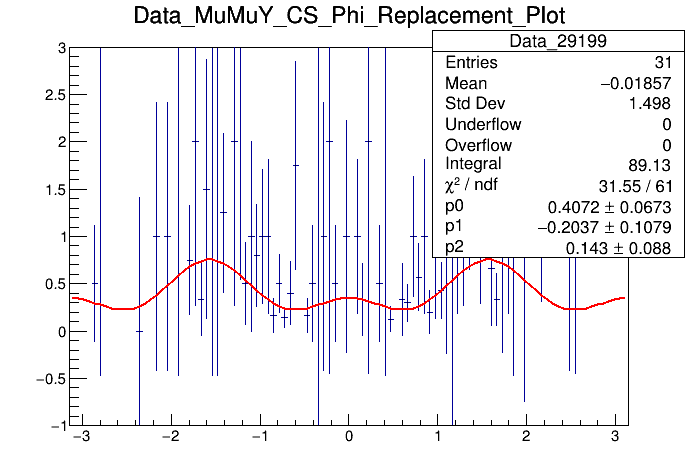
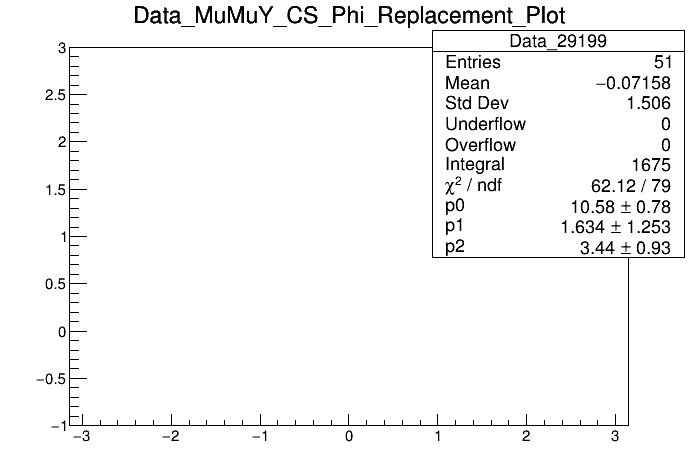
In the following bits of code, I open up 8 root files, select two histograms from each root file, divide them and then fit the resulting histogram. At the moment only on the 1st and 4th iteration of the loops is a histogram not coming out blank. On all the other loop iterations the canvas has the fit statistics on the canvas and all the labels, but there is no data and no fit.
    Double_t fitf(Double_t *x, Double_t *par)
    {
        Double_t fitval = par[0] + par[1]*TMath::Cos(2.0*x[0]) + par[2]*TMath::Cos(4.0*x[0]);
        return fitval;
    }

     void Fitting_Code() { //OPENING BRACE

       //declare a new TFile in which to save histograms
       TFile *file = new TFile ("Division_Plots.root", "RECREATE");
        file->cd();

        const int numfiles = 8;
       TFile* s[numfiles];

       std::vector<std::string> histogram_names = {"one", "Two","Three", "Four", "five", "six", "seven", "eight"/*, "nine", "Ten", "eleven", "Twelve", "Thirten", "Fourteen", "fiften", "sixten"*/};

      TCanvas *b[numfiles];

     std::vector<std::string> root_File_Names = {"Plots_Cos_CS_Theta_Squared_MC.root",
					      "Plots_Cos_CS_Theta_Squared_MC_Low_Q.root",
					      "Plots_Cos_CS_Theta_Squared_MC_High_Q.root",
					      "Plots_Cos_CS_Theta_Squared_MC_Low_qT.root",
					      "Plots_Cos_CS_Theta_Squared_MC_High_qT.root",
					      "Plots_Cos_CS_Theta_Squared_MC_Low_Photon_Pt.root",
					      "Plots_Cos_CS_Theta_Squared_MC_Mid_Photon_Pt.root",
					      "Plots_Cos_CS_Theta_Squared_MC_High_Photon_Pt.root"
     };  //The file containing all the root files needs to be transformed into a string, one string per file and be named the same as the file name

     std::vector<std::string> Hist_List = {"Data_29599", "Data_29199"};

      for (Int_t i = 0; i <numfiles; i++){
      s[i] = TFile::Open(root_File_Names[i].c_str());  //Loops through the file names in the .c_str file

	  TH1D *h1;
	  s[i]->GetObject(Hist_List[0].c_str(), h1);
	  TH1D *h2;
	  s[i]->GetObject(Hist_List[1].c_str(), h2);

	  TH1D *h12 = new TH1D(*h1);

	  h12->Divide(h2,h1,1,1);

	  b[i] = new TCanvas(Form("b%i",i),Form("Plot Canvas %i",i), 700, 500);

	  h12->Draw();

	  h12->GetYaxis()->SetRangeUser(-1.0,3.0);
	  gStyle ->SetOptStat(1111111);
	  gStyle->SetOptFit();

	  TF1 * f1 = new TF1("f1",fitf,-3.14159,3.14159,3);
	  f1->SetParameters(0.25,0.25,0.);

	  h12->Fit(f1,"","",-3.14159,3.14159);
	  h12->Fit(f1,"","",-3.14159,3.14159);

	  h12->Draw();

	  b[i]->SaveAs(Form("c%s.png",histogram_names[i].c_str()));

	  file->cd();
	   b[i]->Write();


      } //closing i loop

  file->cd();

  file->Write();

} //CLOSING BRACE