ROOT Version: 5.34 Platform: Linux Virtual Machine on WIndows10 host Compiler: CINT/ROOT C/C++ Interpreter version 5.18.00
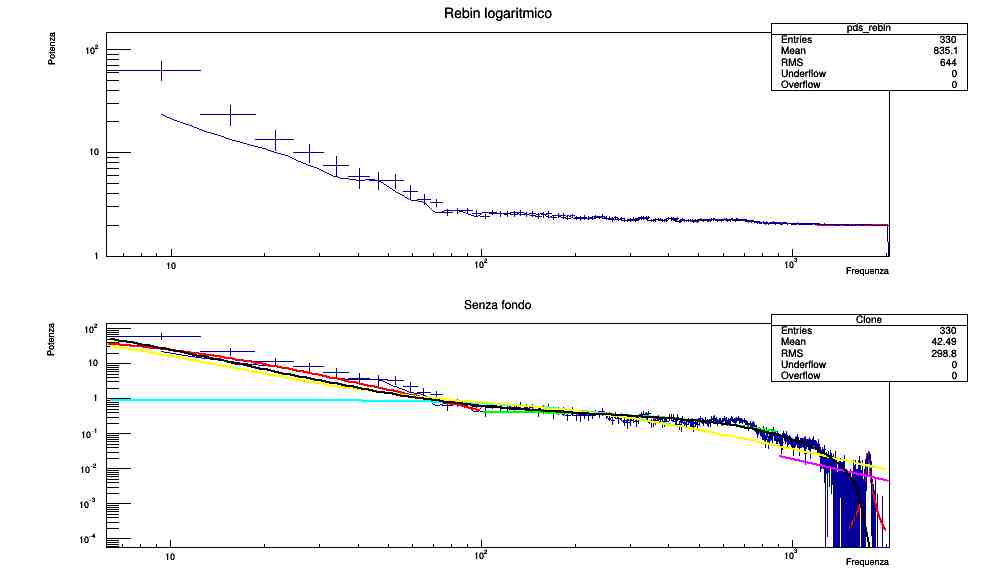
Hello. I’m using ROOT for my astrophysics thesis and I have to recreate a power density spectrum from a .dat file with 4 columns. After reading the file and applying a geometric rebin, I have my data in arrays (frequency, power and respective errors) and I need to create a histogram. I did it in this way
TH1F *pds_rebin= new TH1F(“pds_rebin”,“Rebin logaritmico”,dim,0,2048); //histogram
where ‘potenza’ is the powers array, ‘err_pot_rebin’ is the powers’ errors array and ‘dim’ is the dimension of the arrays (330).
Things work mostly fine (without errors), if it wasn’t that (after subtracting a background), I get my peak at too high frequencies (the red Lorentzian at around 1700 Hz)
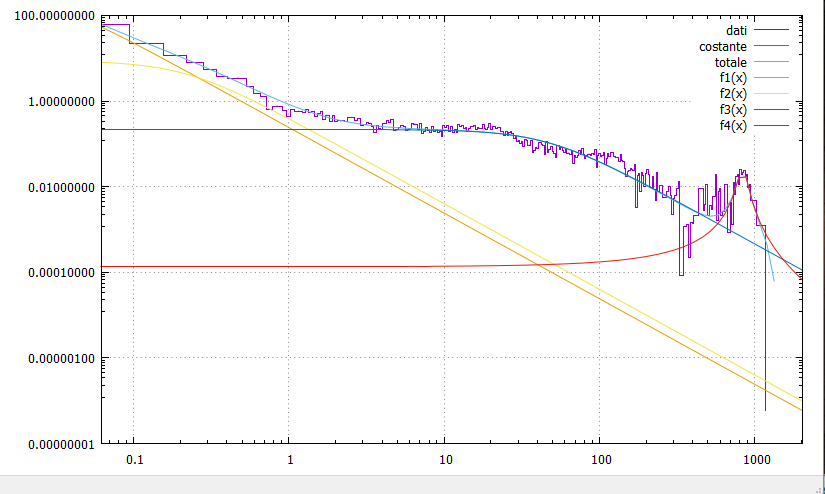
Mm, the last point on the x axis in gnuplot is 2035 (it’s logarithmic scale) so it actually covers all the data, if that’s what you mean. Did I understand it correctly?
So the issue is likely that you use linear histogram bins in ROOT but weird-scale scale ones in Gnuplot: compare the bin widths say at frequency 1000: for ROOT, the bin width is invisible, while for Gnuplot its largish.
You likely have non-uniform bin boundaries. Are some of your columns “frequency” values, describing the bin? If so, don’t create the histogram using TH1F *pds_rebin= new TH1F(...,dim,0,2048); which will create dim equally sized bins between 0 and 2048, but provide the bin borders as a float or double array. Note that for dim bins you need dim + 1 bin boundaries: each of the dim bins has a lower boundary, and the last one also needs to know it’s upper bin boundary!
 Now I see what you meant