So here is a snippet of my code, which takes in information from a tree and implements it into a histogram:
// Create a canvas for the individual histograms:
      TCanvas *c = new TCanvas();


      c->cd();

      // Make a TTree from the data:
      TTree *T = new TTree("ntuple","csv file data");
      Long64_t nlines = T->ReadFile(TString::Format("%sdata%d.csv",dir.Data(), i),"Time:Asignal:Bsignal:Csignal:Dsignal");
      printf(" found %lld points\n",nlines);

      // Develop the histogram:
      TH1F *H = new TH1F("H", "Asignal vs Time; Time; Asignal", 100000, -0.00001, 0.00005);

      // Draw the histogram from Tree:
      T->Draw("Time>>H","Asignal","hist p");

      // To see marker style/size/color options, go to: https://root.cern.ch/doc/master/classTAttMarker.html.
      H->SetMarkerStyle(kFullDotSmall);
      H->SetTitle("Asignal vs Time");

      H->Draw("hist p");
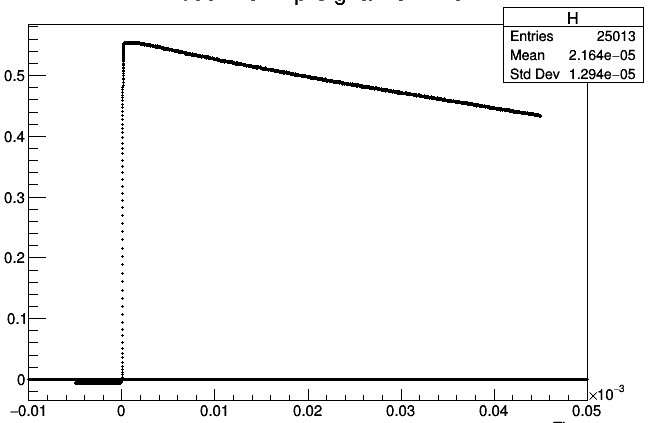
My result is the following:
This is all coming from a data file, of course. But if you look closely at the histogram above, at 0, there is a dark line of data points that are nonexistent in my data file. So, it looks to me like I’m filling H with “Time” so when I plot it (H->Draw()) I’m plotting time vs something (maybe Time?). And I assume that is why I have this flat line.
I was hoping someone could help me with this problem. I have tried using T->Project("hist p","Time","Asignal"); instead of T->Draw("Time>>H","ASignal","hist p"); but that did not work.
#include "TSystem.h"
void plot_AnodePreAmp_histos(const char* ext = ".csv")
{
const char* dir = "<pathname>/ROOT Analysis/";
void* dirp = gSystem->OpenDirectory(dir);
const char* entry;
const char* filename[100];
Int_t n = 0;
TString str;
// Loop over the .csv files in this directory:
while((entry = (char*)gSystem->GetDirEntry(dirp)))
{
str = entry;
if(str.EndsWith(ext))
filename[n++] = gSystem->ConcatFileName(dir, entry);
}
for(Int_t i = 0; i < n; i++)
{
TString dir = "<pathname>ROOT Analysis/";
// dir.Append("/tree/");
dir.ReplaceAll("/./","/");
// Create a new .root file:
TFile *f = new TFile(TString::Format("data%d.root", i), "RECREATE");
// Create a canvas for the individual histograms:
TCanvas *c = new TCanvas();
c->cd();
// Make a TTree from the data:
TTree *T = new TTree("ntuple","csv file data");
Long64_t nlines = T->ReadFile(TString::Format("%sdata%d.csv",dir.Data(), i),"Time:AnodePreAmp:AnodeShaped:CathodePreAmp:CathodeShaped");
printf(" found %lld points\n",nlines);
// Develop the histogram:
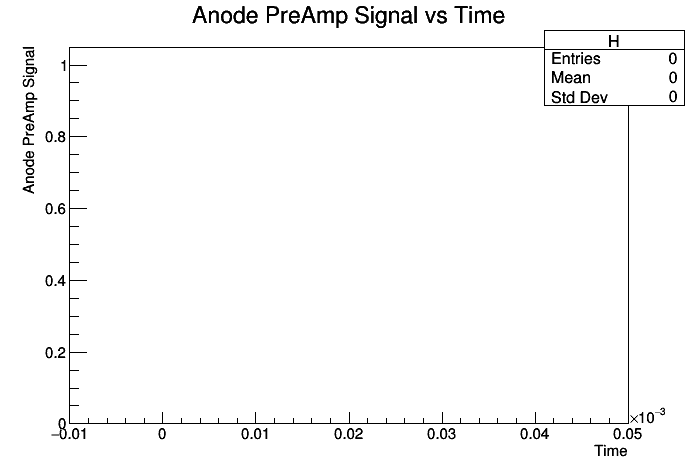
TH1F *H = new TH1F("H", "Anode PreAmp Signal vs Time; Time; Anode PreAmp Signal", 100000, -0.00001, 0.00005);
// Draw the histogram from Tree:
T->Draw("Time>>H","AnodePreAmp","hist p");
// To see marker style/size/color options, go to: https://root.cern.ch/doc/master/classTAttMarker.html.
H->SetMarkerStyle(kFullDotSmall);
H->SetTitle("Anode PreAmp Signal vs Time");
H->Draw("hist p");
gSystem->ProcessEvents();
TImage *img = TImage::Create();
img->FromPad(c);
// Save the histograms as .png images individually:
img->WriteImage(TString::Format("data%d.png",i));
T->Write();
H->Write();
}
}
The line of points at the origin is not a big problem when looking at the first plot above, but it certainly gets in the way when I’m attempting to use an error function fit. So I’d just like to get rid of that.
Again, thank you
if you want to draw “a versus b” you need a 2 dimensional histogram, not a TH1F
if you draw “Time:Asignal” (or is it “AnodePreAmp”?) the result will be in a TGraph; else you can use >>histname
Are you sure that the reading of the file worked? Maybe you could check whether the number of entries in the tree corresponds to the expected number of lines of the csv file?