ROOT Version: 6.22/02
Platform: Ubuntu
Compiler: GCC
Hello,
i started working on pyroot for plotting and fitting histograms.
So below the code:
“”"""""""""""""""""""
import ROOT
hist = ROOT.TH1D(“x”, “”,1000,-10,10)
hist.FillRandom(“gaus”,1000000)
c1 = ROOT.TCanvas()
gaussFit = ROOT.TF1 (" gaussfit “,” gaus " ,-1 ,1)
hist.Fit(gaussFit,“E”)
hist.Draw()
gaussFit.Draw(“same”)
c1.Update()
input()
“”"""""""""""""""""""
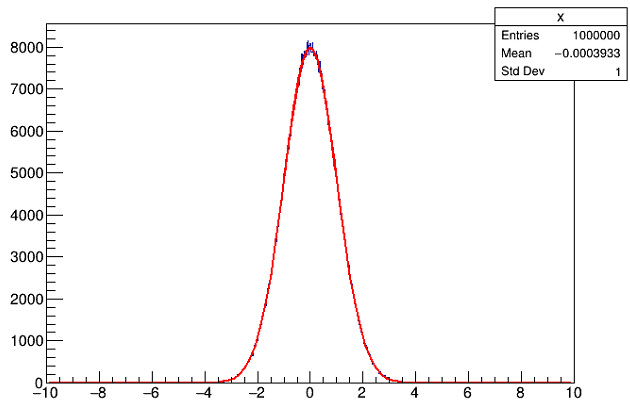
Basically, this code fills a histogramm with a gaussian and additionally fit a gaussian curve in the range -1 to 1. The problem is that the fit function ignores the boundaries -1 to 1 and fits over the hole range (see picture). Is it a bug in root 6.22/02 or is my code incorrect.