Dear experts,
Reproducer
import ROOT

def draw_histo(canvas_name, histo_name, histo_color, n_entries):
    c = ROOT.TCanvas(canvas_name, canvas_name)
    h = ROOT.TH1F(histo_name, histo_name, 200, -3, 3)
    h.FillRandom("gaus", n_entries)
    h.SetLineColor(histo_color)
    h.DrawClone()
    c.Update()
    return c

c1 = draw_histo("c1", "h1", ROOT.kBlack, 1000)
c2 = draw_histo("c2", "h2", ROOT.kRed, 900)
c3 = draw_histo("c3", "h3", ROOT.kBlue, 800)
input("Test 1. Press a button for test 2")

c1 = draw_histo("c1", "h1", ROOT.kBlack, 100000)
c2 = draw_histo("c2", "h2", ROOT.kRed, 90000)
c3 = draw_histo("c3", "h3", ROOT.kBlue, 80000)
input("Test 2... Press a button to exit")
Observed behaviour
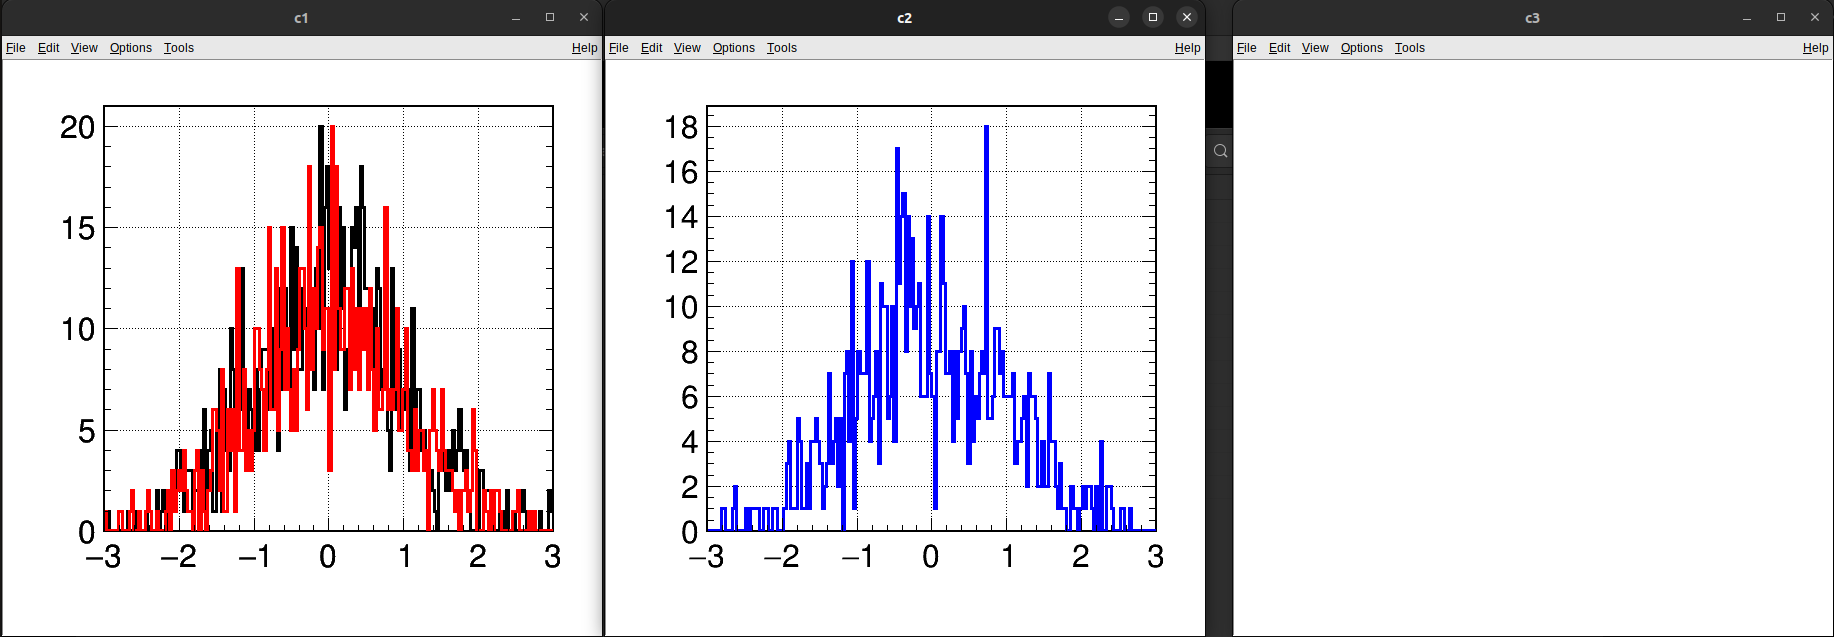
The first part of the code produces black and red histograms together on c1; the blue histogram on c2 and c3 remains empty. I can reproduce this behaviour consistently.
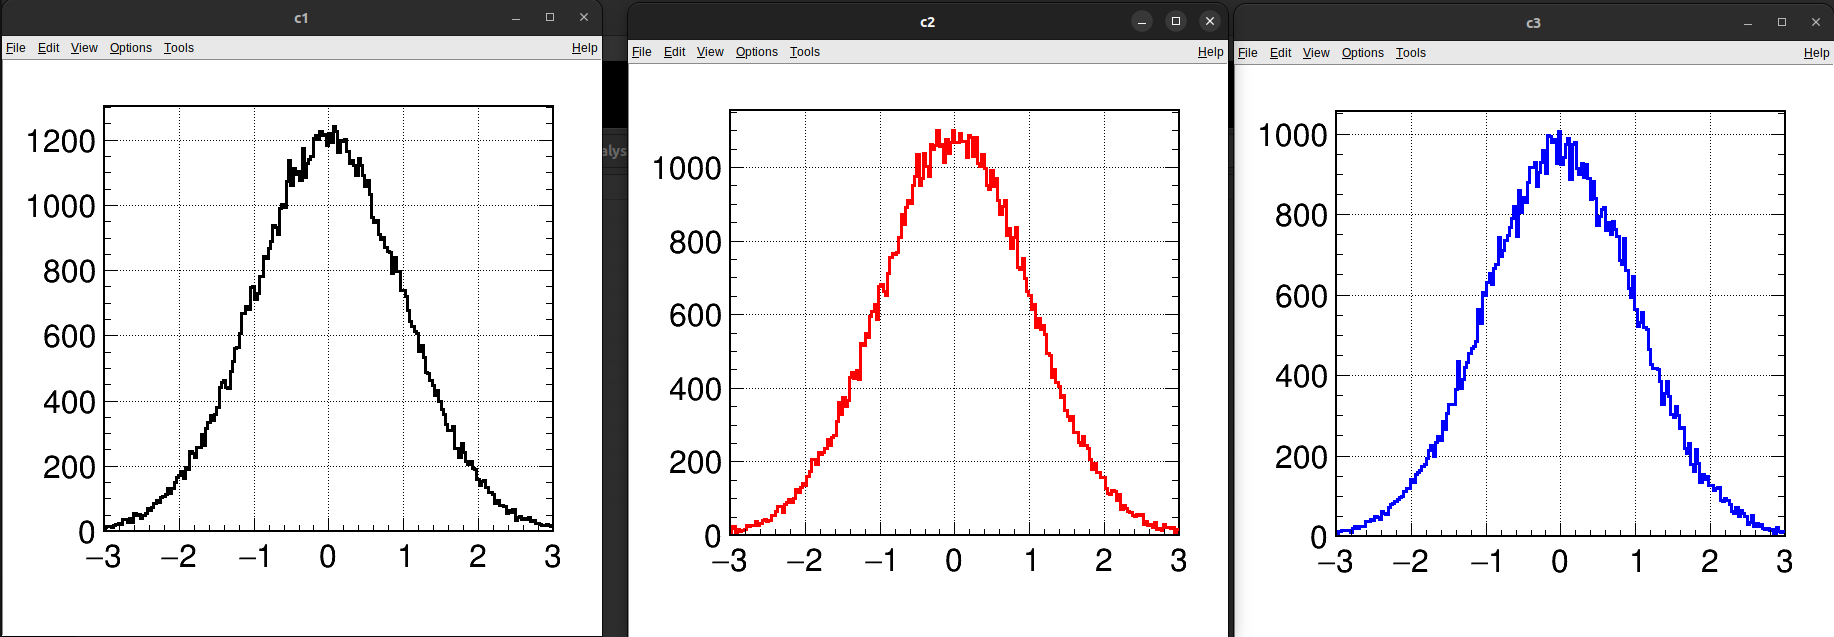
The second part of the code works as expected. The only difference is the number of entries, which I find very puzzling.
I deal with many histograms in my analysis, which I would like to produce in functions as in the example above. Many of them overlap on the same canvases, even with a large number of entries.
Expected behaviour
I expect it to consistently produce the black histogram on the c1 canvas, the red on the c2 canvas and the blue on the c3 canvas, no matter the number of entries.
Environment
OS: Centos 7
ROOT Version: 6.30/06
Python 3.9.12
g++ (GCC) 11.3.0